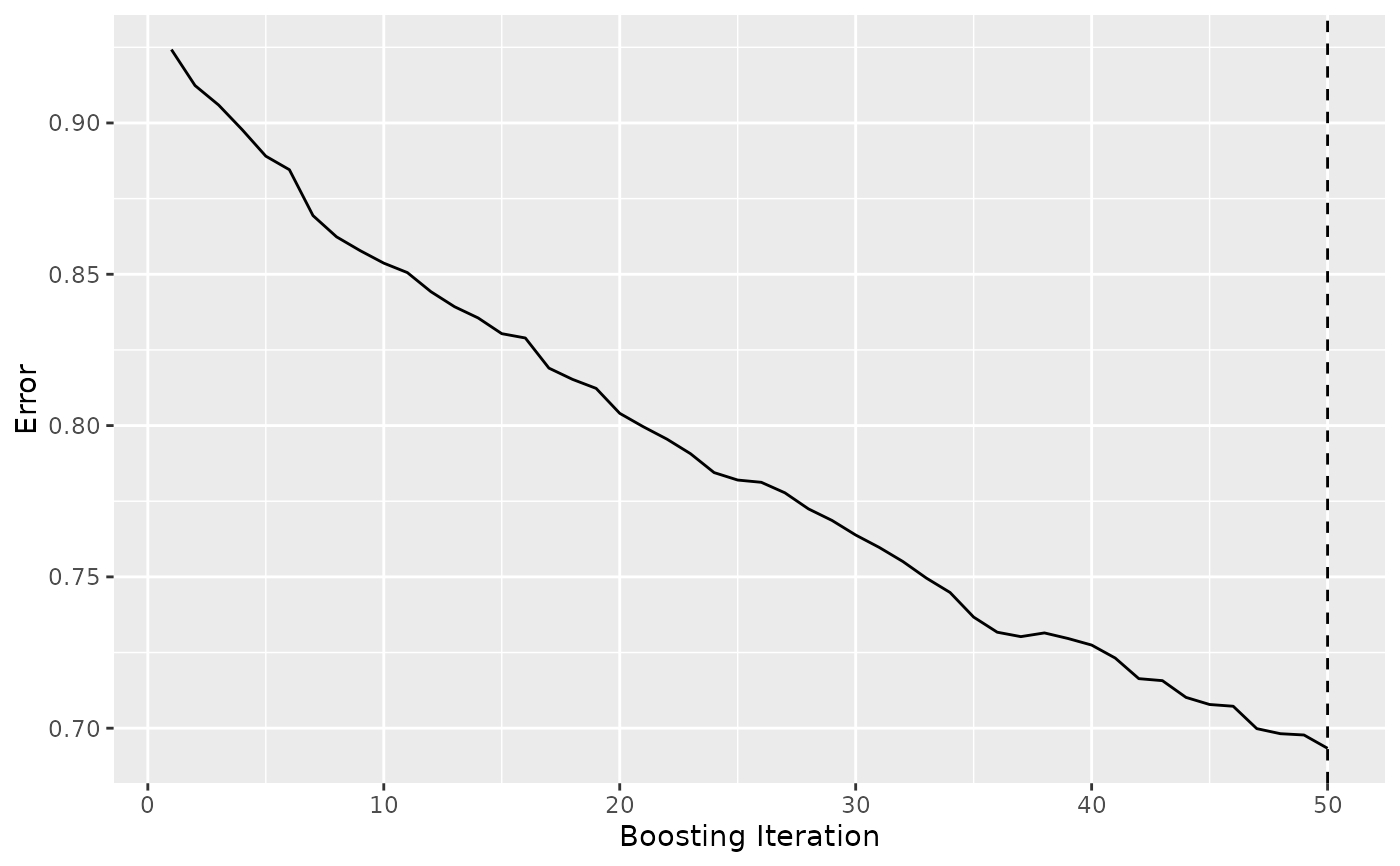
The error path of a boosted multivariate tree fit against the boosting iteration, with the cross-validated optimal iteration marked.
Usage
# S3 method for class 'gg_boost_error'
autoplot(object, optimal = TRUE, ...)

# S3 method for class 'gg_boost_error'
plot(x, optimal = TRUE, ...)
Arguments
- object
A
gg_boost_errorobject.- optimal
Logical. Draw a vertical rule at the optimal iteration. Defaults to
TRUE.- ...
Passed to
geom_line.- x
A
gg_boost_errorobject.
Details
The returned plot carries no theme, so it composes with any ggplot2
theme or scale. Several responses are drawn as facets rather than as
coloured series, because the responses do not share a y scale.
Examples
# \donttest{
sim <- boostmtree::simLong(n = 25, n.time = 4, model = 1)$data.list
fit <- boostmtree::boostmtree(
x = sim$features, tm = sim$time, id = sim$id, y = sim$y,
M = 50, cv.flag = TRUE, verbose = FALSE
)
plot(gg_boost_error(fit))
 # }