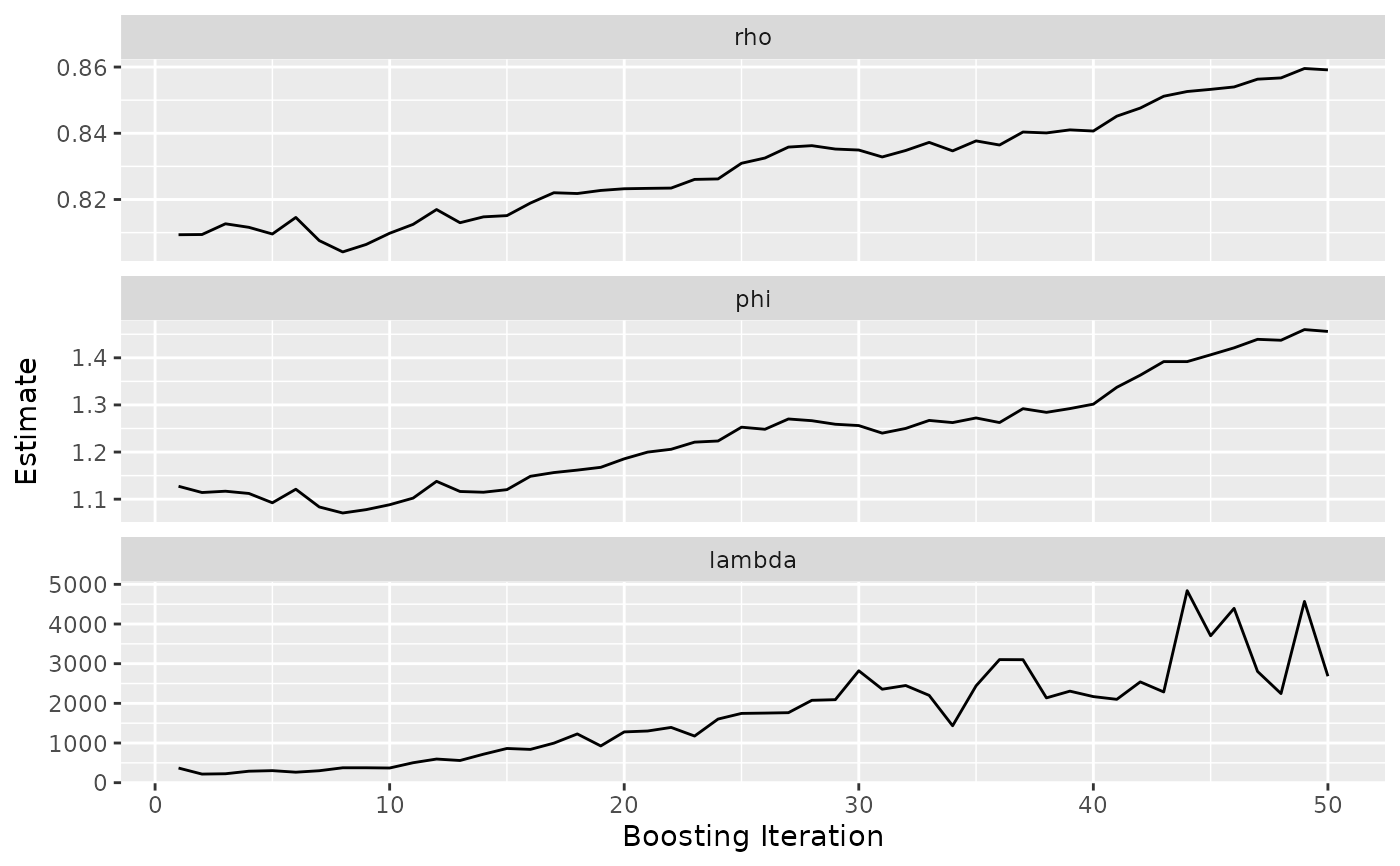
The estimated correlation, variance, and smoothing parameter paths of a boosted multivariate tree fit against the boosting iteration.
Usage
# S3 method for class 'gg_boost_path'
autoplot(object, ...)

# S3 method for class 'gg_boost_path'
plot(x, ...)
Arguments
- object
A
gg_boost_pathobject.- ...
Passed to
geom_line.- x
A
gg_boost_pathobject.
Details
The three parameters live on entirely different scales, so they are always faceted with a free y axis rather than drawn together. With several responses the facet grid is parameter by response.
The returned plot carries no theme.
Examples
# \donttest{
sim <- boostmtree::simLong(n = 25, n.time = 4, model = 1)$data.list
fit <- boostmtree::boostmtree(
x = sim$features, tm = sim$time, id = sim$id, y = sim$y,
M = 50, cv.flag = TRUE, verbose = FALSE
)
plot(gg_boost_path(fit))
 # }