Plot a gg_boost_trajectory object
Source: R/plot.gg_boost_trajectory.R
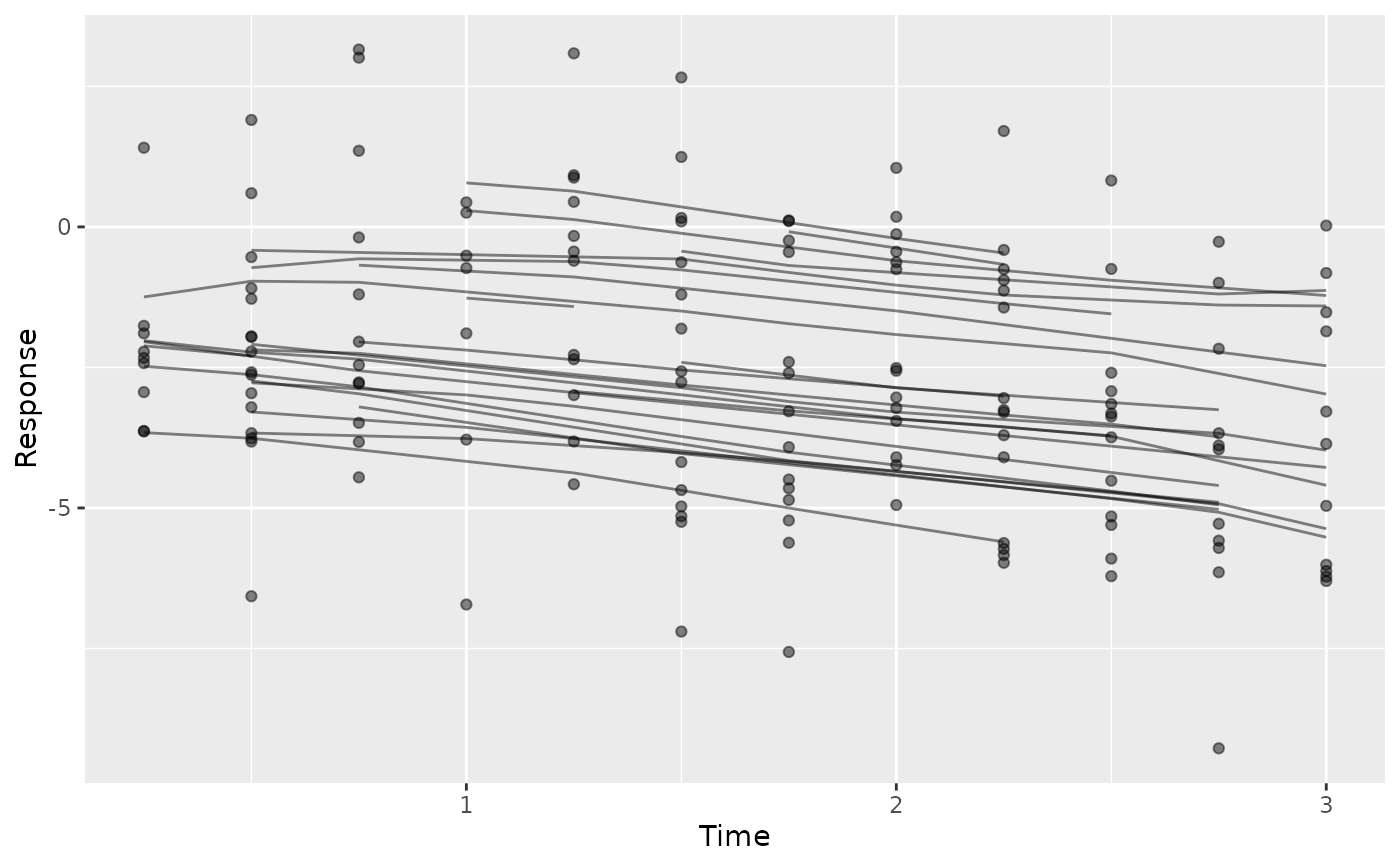
autoplot.gg_boost_trajectory.RdObserved and fitted subject trajectories over time: one line per subject through the fitted values, with the observed values as points.
Usage
# S3 method for class 'gg_boost_trajectory'
autoplot(
  object,
  subset = NULL,
  n_max = 100,
  observed = TRUE,
  alpha = NULL,
  ...
)

# S3 method for class 'gg_boost_trajectory'
plot(x, subset = NULL, n_max = 100, observed = TRUE, alpha = NULL, ...)
Arguments
- object
A
gg_boost_trajectoryobject.- subset
Character or numeric vector of subject identifiers to keep.
NULL(default) keeps all of them.- n_max
Maximum number of subjects to draw. Defaults to 100;
Infdraws every subject.- observed
Logical. Draw the observed values as points. Defaults to
TRUE, and is ignored when the fit records no observed values.- alpha
Numeric transparency for both layers.
NULL(default) computes one from the number of subjects drawn.- ...
Passed to
geom_line.- x
A
gg_boost_trajectoryobject.
Details
The extractor returns every subject, so thinning happens here and the tidy
data frame always represents the whole fit. subset names the subjects to
keep; n_max caps how many are drawn, sampling at random and saying so.
Set n_max = Inf to draw all of them. Random sampling is not seeded –
call set.seed() first for a reproducible figure.
Transparency is doing real work in this figure rather than decorating it.
A cohort of any size overplots, and partial transparency turns the tangle
into something you can read densities off: where many subjects follow the
same path the ink accumulates. The default alpha therefore falls as the
number of subjects drawn rises. Pass alpha explicitly to override.
The returned plot carries no theme.
Examples
# \donttest{
sim <- boostmtree::simLong(n = 25, n.time = 4, model = 1)$data.list
fit <- boostmtree::boostmtree(
x = sim$features, tm = sim$time, id = sim$id, y = sim$y,
M = 50, verbose = FALSE
)
plot(gg_boost_trajectory(fit))
 # }