Extract observed and fitted longitudinal trajectories from a boosted multivariate tree fit, one row per observation.
Arguments
- object
A fitted
boostmtreeobject, or a fittedBoostMLRobject.- ...
Not used; present for S3 consistency.
Value
A gg_boost_trajectory data.frame with columns:
- id
Factor subject identifier, taken from
id.unique.- time
Numeric observation time, ascending within subject.
- fitted
Numeric fitted value.
- observed
Numeric observed value, or
NA.- response
Factor naming the response.
Details
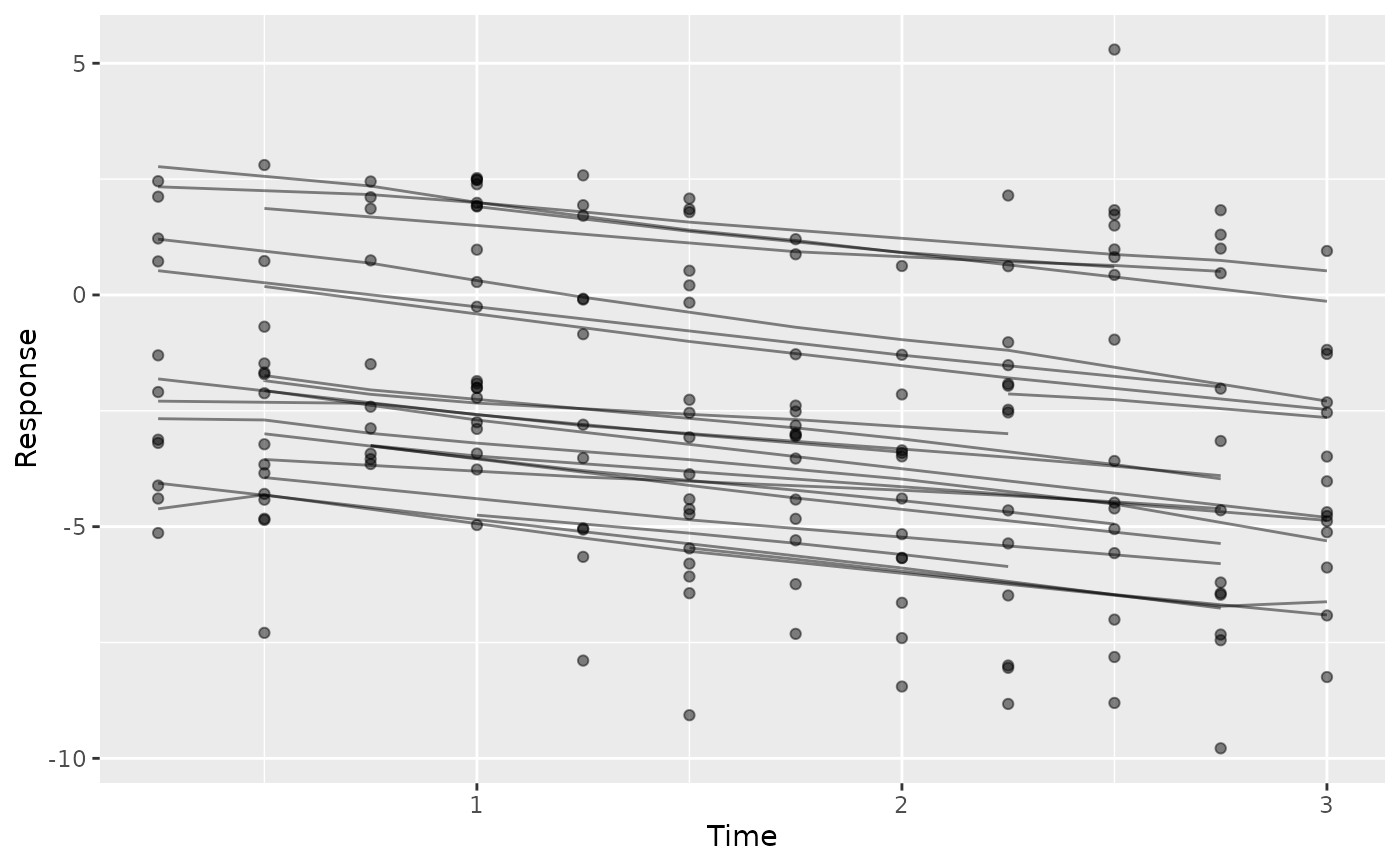
This is the figure longitudinal boosting exists for: whether the model tracks individual subjects over time, rather than only fitting the population mean.
boostmtree stores time, mu and y.org as parallel lists of
per-subject vectors, in the order observations were supplied rather than in
time order. Rows here are sorted by time within each subject, and the
assembled frame is response-major (all subjects for one response, then the
next), so a line drawn through one subject's rows follows the trajectory
instead of zigzagging. Subject identifiers come from the fit's own
id.unique, not from a positional index.
observed is NA throughout when the fit carries no observed response,
which happens for a prediction on new data.
This figure accepts either a boostmtree or a BoostMLR fit.
BoostMLR stores mu and y as flat observation-by-response matrices,
with tm and id as parallel flat vectors, rather than boostmtree's
nested per-subject lists – entirely different layout for the same
information. Response labels come from y_Names, since mu carries no
column names. BoostMLR is natively multi-response, so a fit typically
yields several response blocks even for a "single" model.
Examples
# \donttest{
sim <- boostmtree::simLong(n = 25, n.time = 4, model = 1)$data.list
fit <- boostmtree::boostmtree(
x = sim$features, tm = sim$time, id = sim$id, y = sim$y,
M = 50, verbose = FALSE
)
plot(gg_boost_trajectory(fit))
 # }