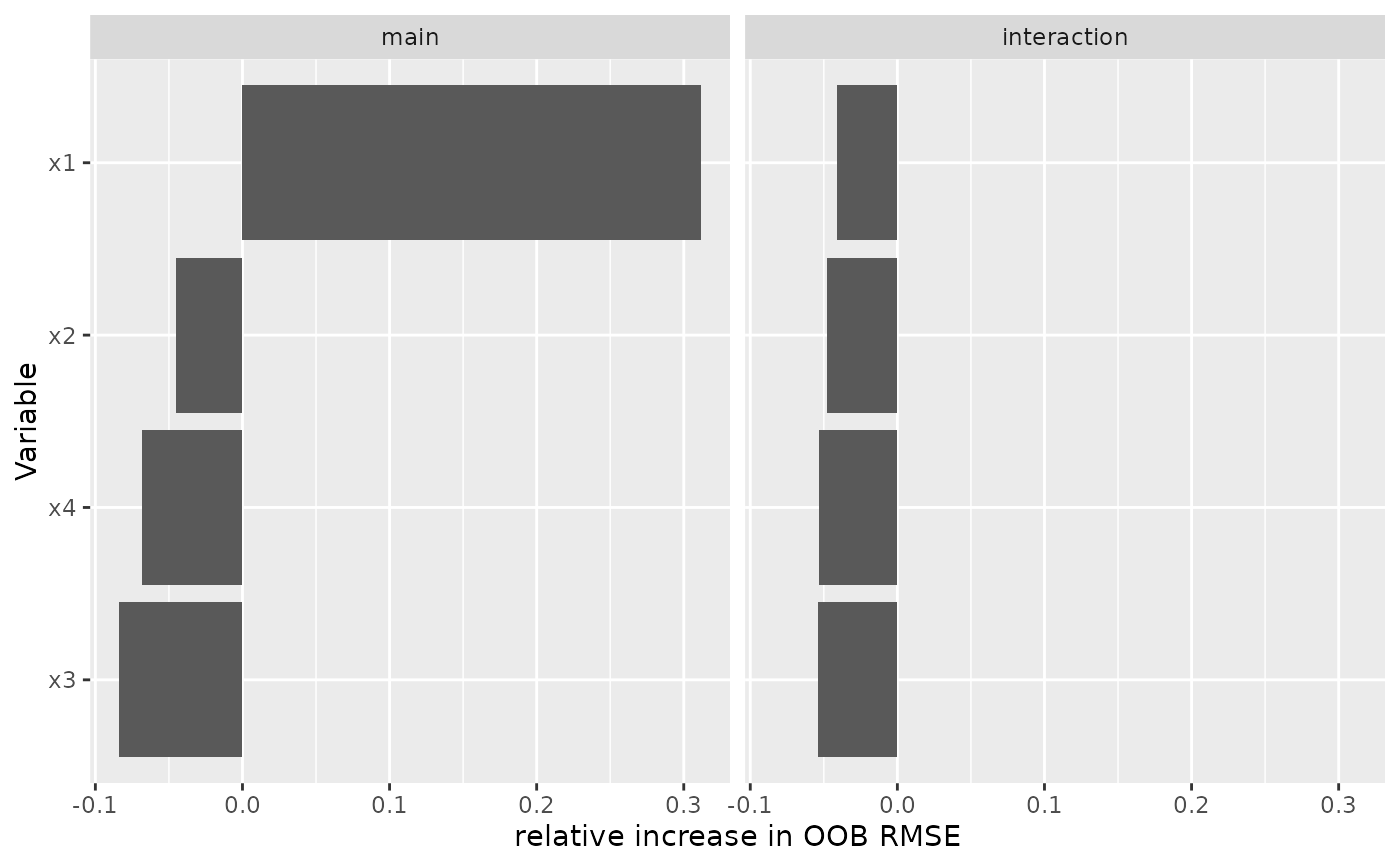
Variable importance as a horizontal bar chart, ordered by importance and faceted by component.
Usage
# S3 method for class 'gg_boost_vimp'
autoplot(object, ...)

# S3 method for class 'gg_boost_vimp'
plot(x, ...)
Arguments
- object
A
gg_boost_vimpobject.- ...
Passed to
geom_col.- x
A
gg_boost_vimpobject.
Details
Bars run horizontally because variable names are text and read better along the y axis than rotated beneath it, and variables are ordered by importance because an importance chart in arbitrary order is close to unreadable.
The x axis is labelled with the metric attribute carried by the extracted
object. That metric is a property of how importance was computed rather than
a fixed quantity, so a hard-coded label would misdescribe some objects.
A negative importance is not an error: with a permutation-style metric a variable that contributes nothing can score slightly below zero by chance.
The returned plot carries no theme.
Examples
# \donttest{
sim <- boostmtree::simLong(n = 25, n.time = 4, model = 1)$data.list
fit <- boostmtree::boostmtree(
x = sim$features, tm = sim$time, id = sim$id, y = sim$y,
M = 50, cv.flag = TRUE, verbose = FALSE
)
plot(gg_boost_vimp(boostmtree::vimp.boostmtree(fit)))
 # }