Produces a synthetic data frame that resembles a typical SAS export from a
cardiac-surgery propensity score analysis. Propensity scores are generated
from a logistic model driven by the supplied covariates, so the resulting
prob_t column has realistic overlap and the SMD values are non-trivial.
Arguments
- n
Number of patients per treatment arm. Total rows =
2 * n. Must be a positive integer. Default500.- seed
Random seed for reproducibility. Default
42L. The fixed default gives the same demo dataset on every call.NULLdraws from the caller's random-number stream, asps_match()does: the data differ from call to call, andset.seed()before the call reproduces them. A negative seed gives the same data as its absolute value.- separation
Numeric scalar controlling how well the covariates separate the two groups. Higher values give less overlap. Default
1.0.
Value
A data frame with 2 * n rows and the following columns:
idInteger patient identifier.
tavrBinary treatment indicator:
0= SAVR,1= TF-TAVR.ageContinuous: age in years.
femaleBinary:
1= female.efContinuous: ejection fraction (%).
diabetesBinary:
1= diabetic.hypertensionBinary:
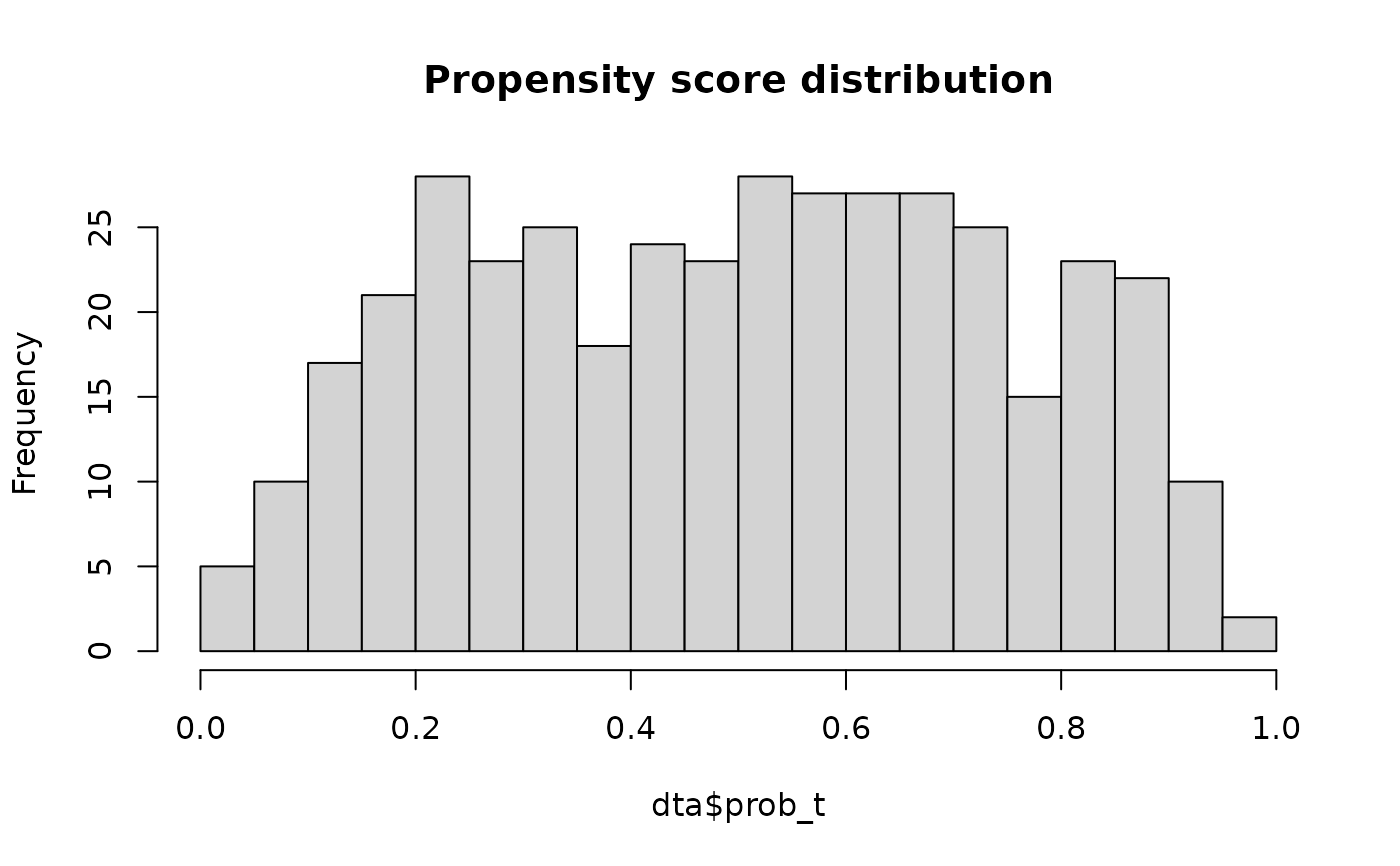
1= hypertensive.prob_tEstimated propensity score (numeric, 0 to 1).
matchMatch indicator, initialised to
0. Populated byps_match().
Examples
dta <- sample_ps_data(n = 200, seed = 42)
head(dta)
#>   id tavr      age female       ef diabetes hypertension    prob_t match
#> 1  1    0 88.96767      0 51.95379        1            1 0.1112484     0
#> 2  2    0 73.48241      0 59.60242        0            1 0.5270896     0
#> 3  3    0 80.90503      1 52.38991        1            0 0.3951929     0
#> 4  4    0 83.06290      0 59.35072        0            1 0.2836606     0
#> 5  5    0 81.23415      1 50.53527        0            0 0.3751620     0
#> 6  6    0 77.15100      0 51.42113        0            0 0.3148051     0
table(dta$tavr)
#>
#>   0   1
#> 200 200
hist(dta$prob_t, breaks = 20, main = "Propensity score distribution")