Plot a gg_survival object.
Arguments
- x
gg_survivalor a survivalgg_rfsrcobject created from arfsrcobject- type
"surv", "cum_haz", "hazard", "density", "mid_int", "life", "proplife"
- error
"shade", "bars", "lines" or "none"
- label
Modify the legend label when gg_survival has stratified samples
- ...
not used
Examples
## -------- pbc data
data(pbc, package = "randomForestSRC")
pbc$time <- pbc$days / 364.25
# This is the same as kaplan
gg_dta <- gg_survival(
interval = "time", censor = "status",
data = pbc
)
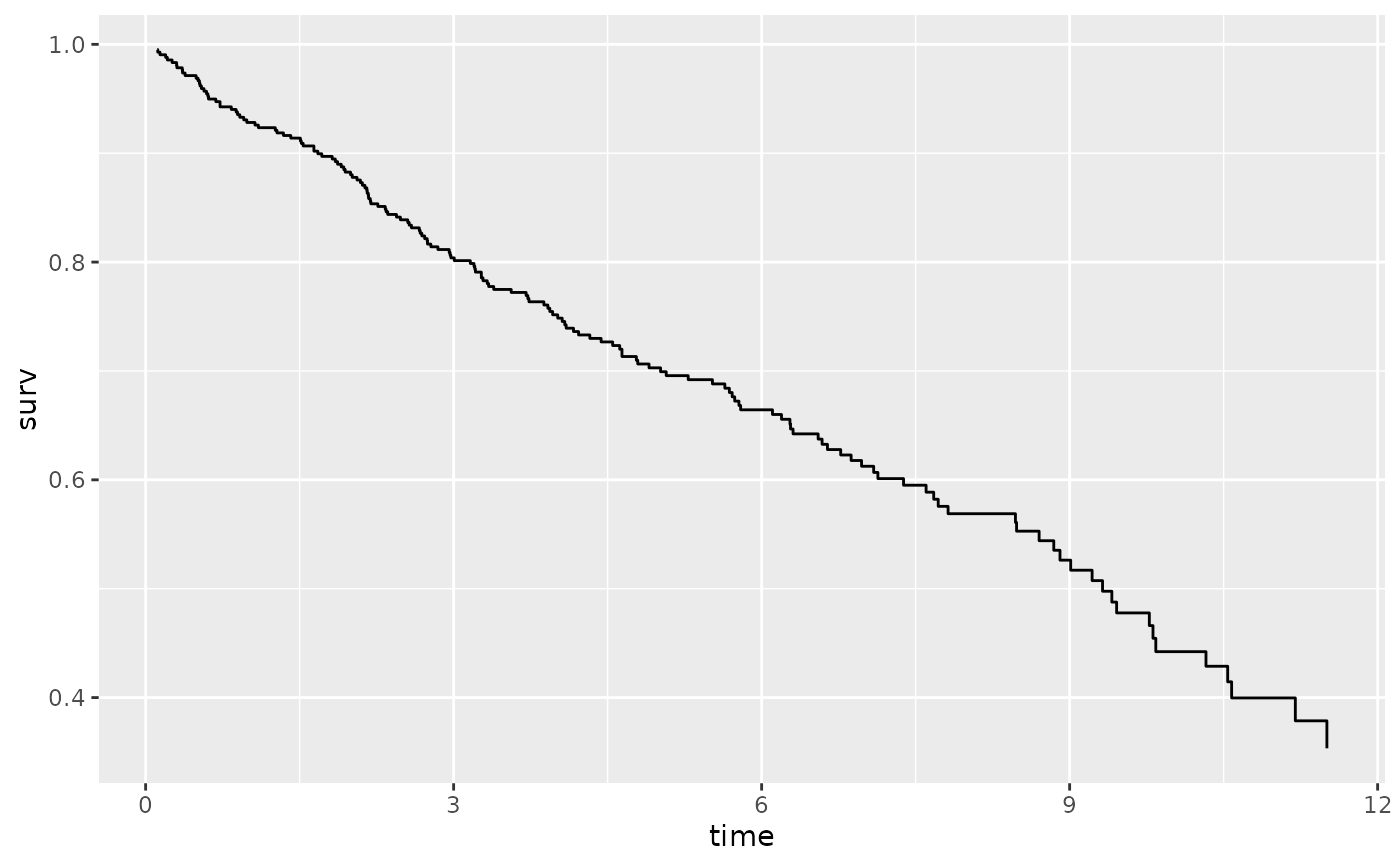
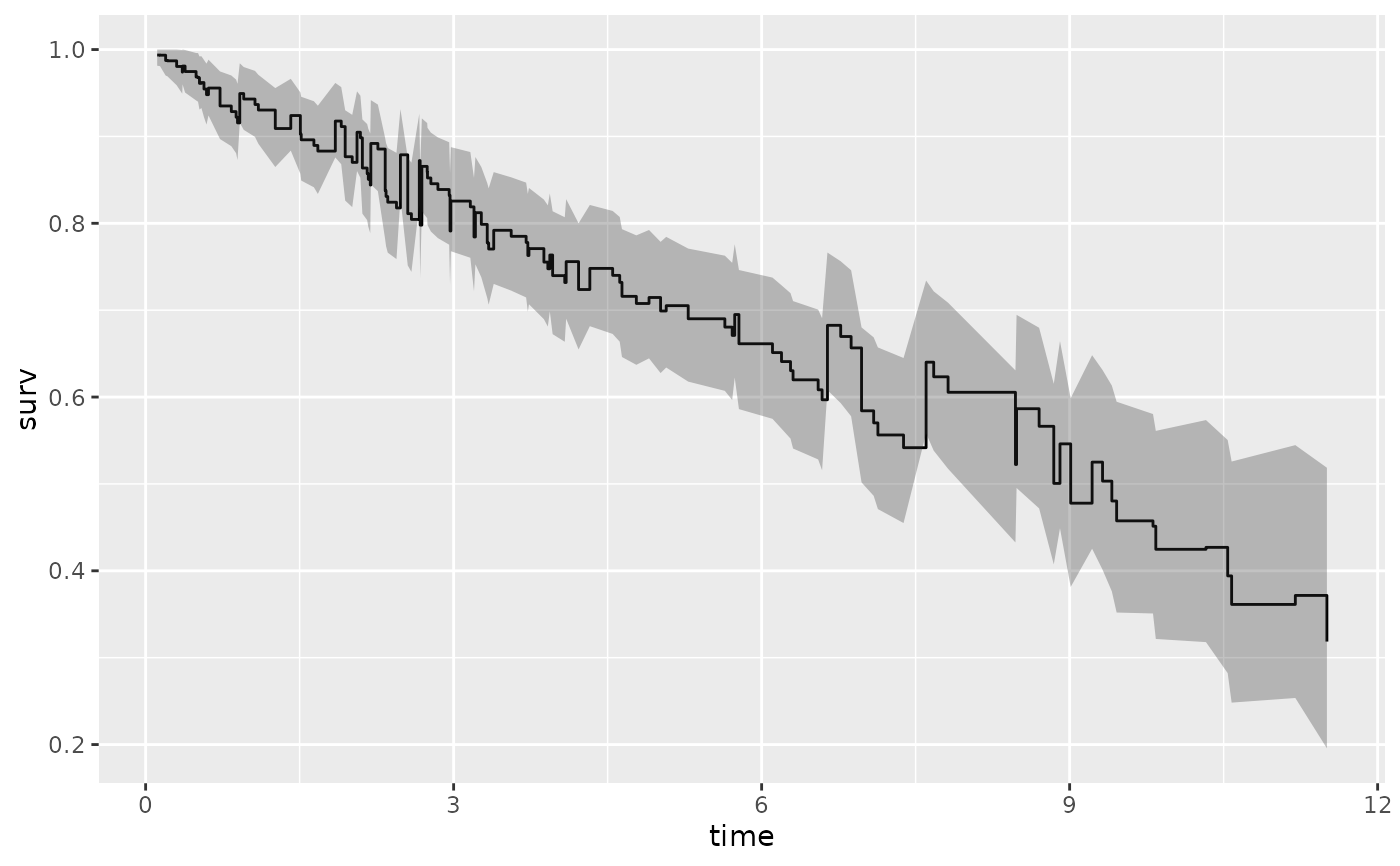
plot(gg_dta, error = "none")
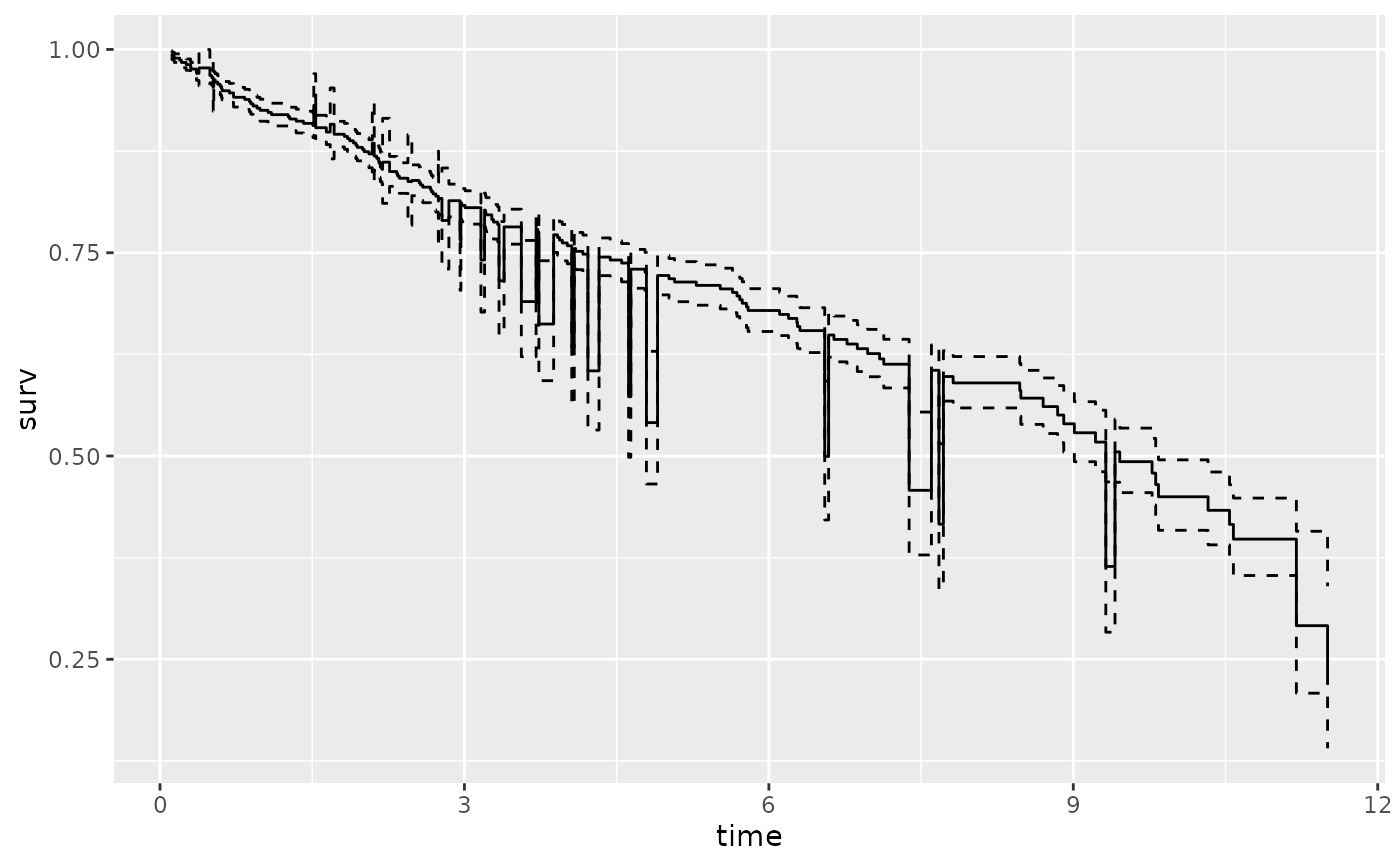
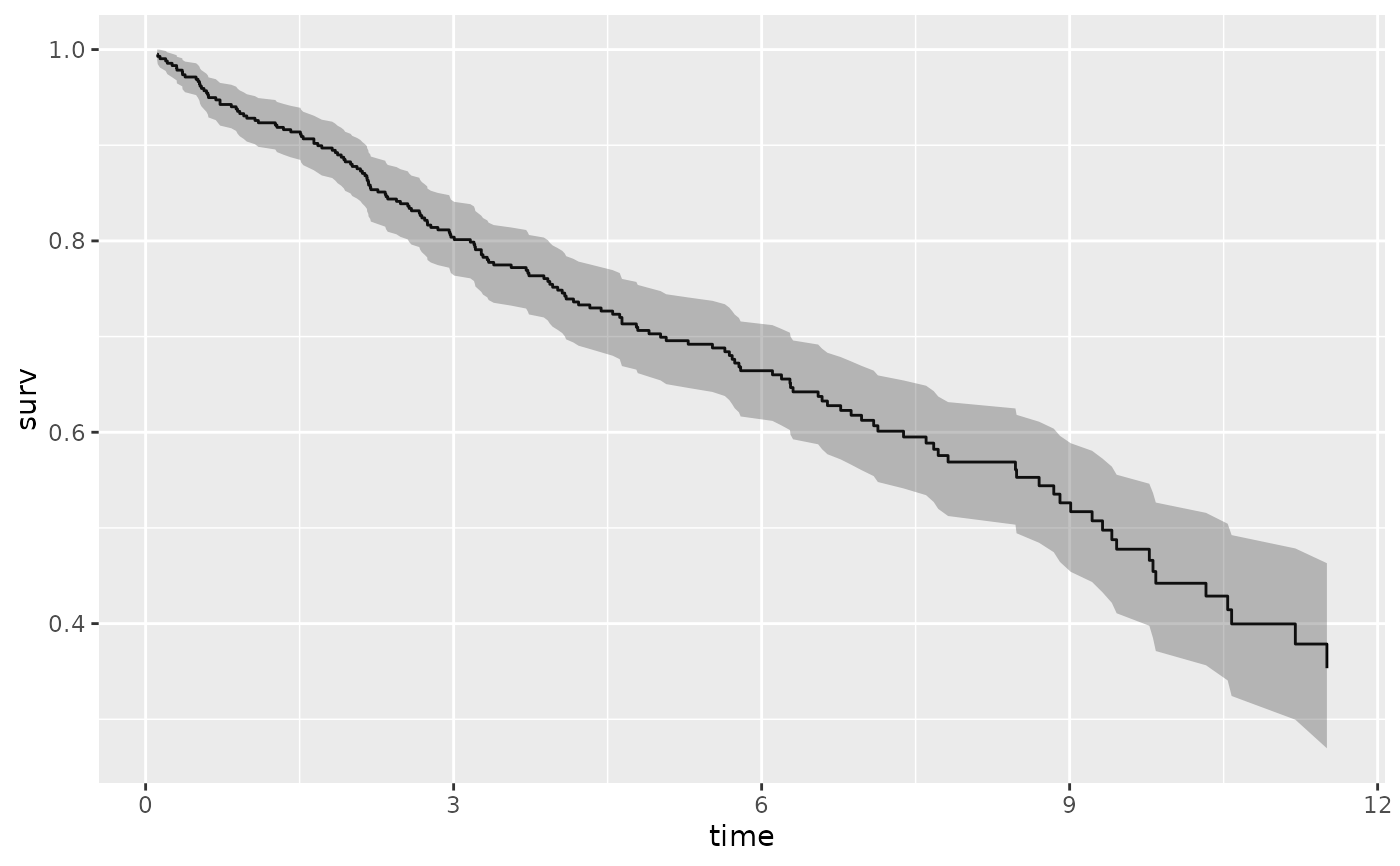
 plot(gg_dta)
 # Stratified on treatment variable.
gg_dta <- gg_survival(
interval = "time", censor = "status",
data = pbc, by = "treatment"
)
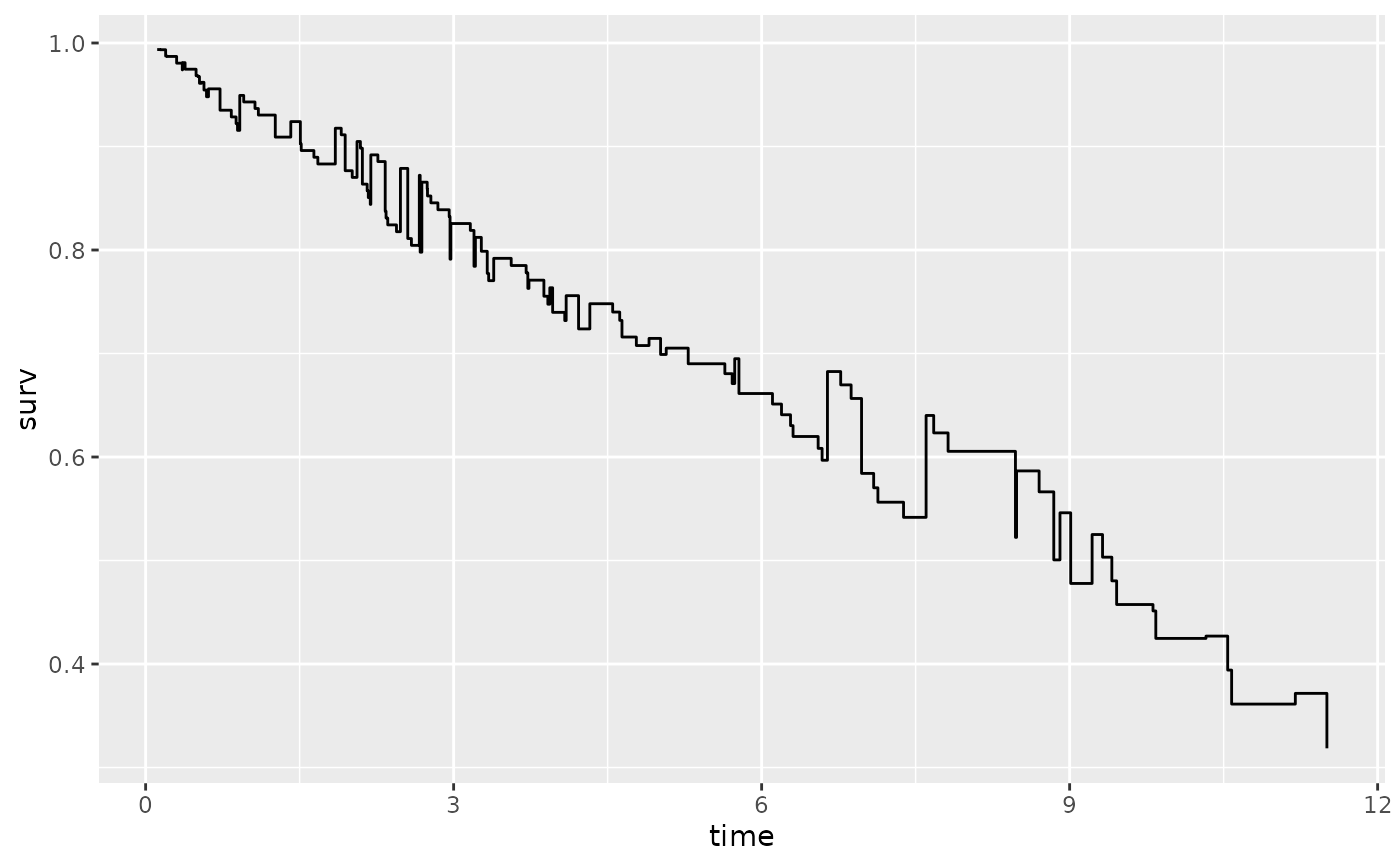
plot(gg_dta, error = "none")
# Stratified on treatment variable.
gg_dta <- gg_survival(
interval = "time", censor = "status",
data = pbc, by = "treatment"
)
plot(gg_dta, error = "none")
 plot(gg_dta)
 plot(gg_dta, label = "treatment")
 # ...with smaller confidence limits.
gg_dta <- gg_survival(
interval = "time", censor = "status",
data = pbc, by = "treatment", conf.int = .68
)
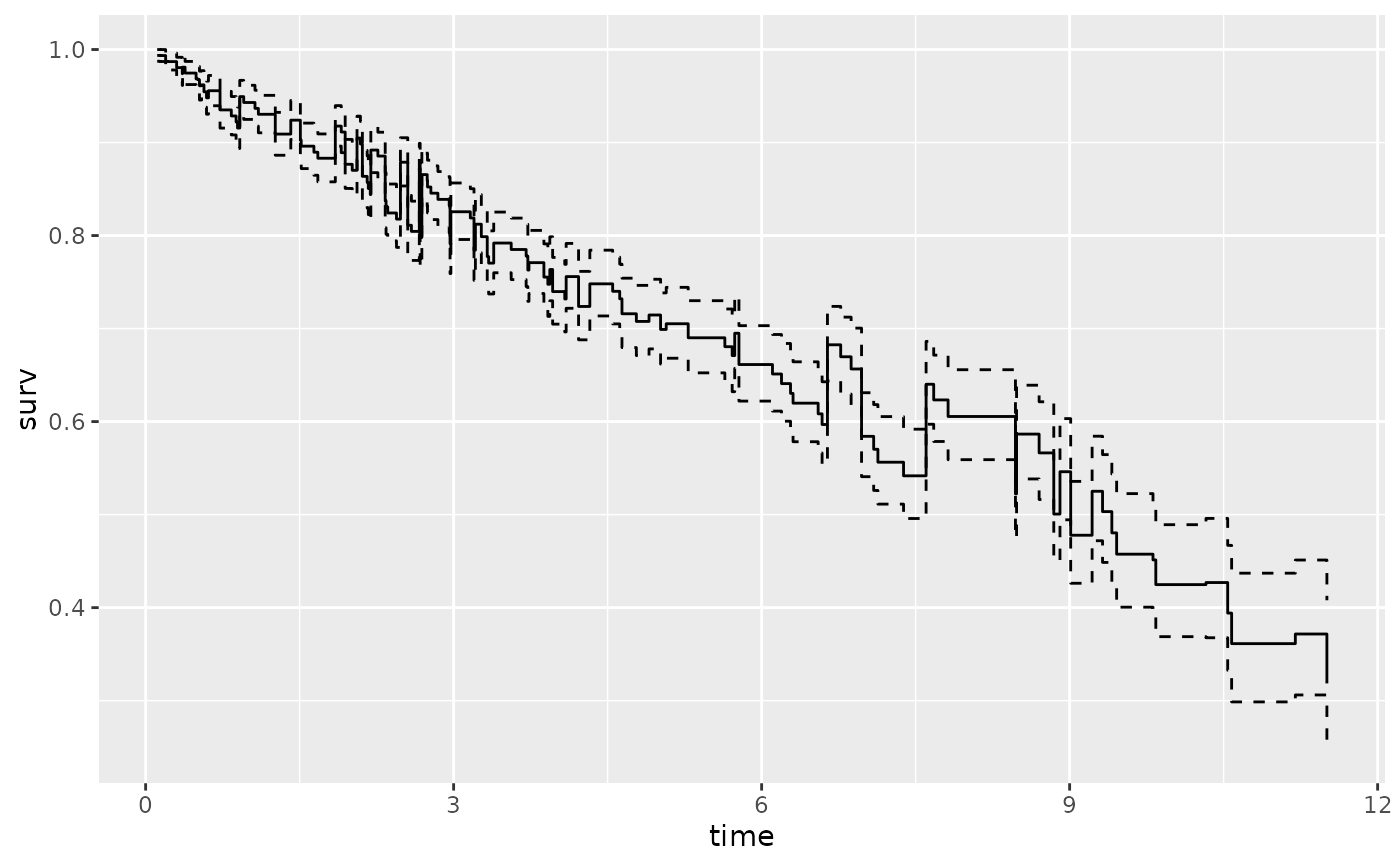
plot(gg_dta, error = "lines")
# ...with smaller confidence limits.
gg_dta <- gg_survival(
interval = "time", censor = "status",
data = pbc, by = "treatment", conf.int = .68
)
plot(gg_dta, error = "lines")
 plot(gg_dta, label = "treatment", error = "lines")
 # ...with smaller confidence limits.
gg_dta <- gg_survival(
interval = "time", censor = "status",
data = pbc, by = "sex", conf.int = .68
)
plot(gg_dta, error = "lines")
# ...with smaller confidence limits.
gg_dta <- gg_survival(
interval = "time", censor = "status",
data = pbc, by = "sex", conf.int = .68
)
plot(gg_dta, error = "lines")
 plot(gg_dta, label = "sex", error = "lines")