Pulls the per-tree importance scores out of a fitted varpro object
and summarizes them into a data structure the plot method can draw as a
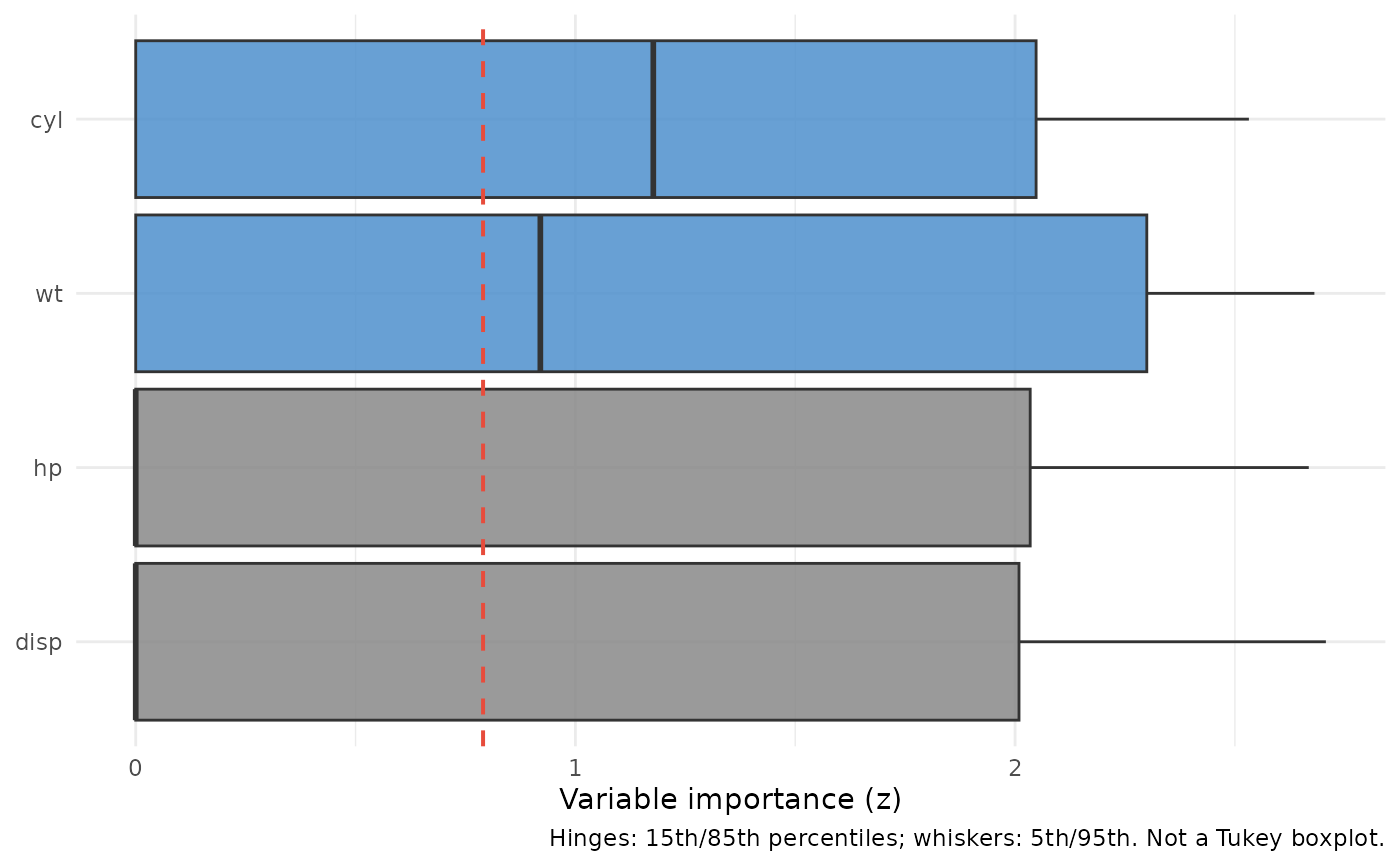
boxplot. The box hinges are the 15th and 85th percentiles and the
whiskers run to the 5th and 95th – not the usual Tukey 1.5 IQR whiskers.
For a classification forest you can also keep the class-conditional
importances.
Usage
gg_varpro(
  object,
  local.std = TRUE,
  cutoff = 0.79,
  faithful = FALSE,
  conditional = FALSE,
  nvar = NULL,
  ...
)
Arguments
- object
A fitted
varproobject (required).- local.std
Logical; default
TRUE. WhenTRUEthe per-tree importances are put on the z-scale before the box statistics are computed. Set itFALSEto keep the raw importance scale, which is whattype = "raw"inplot.gg_varproneeds.- cutoff
Numeric; the z-score above which a variable is treated as selected. Default
0.79. A variable with aggregate z above the cutoff is flaggedselected = TRUEin$imp.- faithful
Logical; default
FALSE. WhenTRUE,$imp.treeis kept soplot.gg_varprocan scatter the per-tree points over the box.- conditional
Logical; default
FALSE. WhenTRUE, and only for a classification forest, the$conditional.zmatrix is extracted and stored as$conditional.- nvar
Integer; keep only the top
nvarvariables, ranked by median per-tree z, after the cutoff filter has been applied.NULLkeeps all of them.- ...
Additional arguments passed to
varPro::importance().
Value
A named list of class "gg_varpro" with elements:
$impSummary data frame:
variable(factor whose levels run least- to most-important by median per-tree z, so the most-important variable sits at the top of the plot aftercoord_flip),z(aggregate z-score fromimportance()),selected(logical,z > cutoff).$imp.treeNULLwhenfaithful = FALSE; otherwise an ntree x p matrix of per-tree importance values.$statsPer-variable summary:
variable,median,q05,q15,q85,q95(on z-scale whenlocal.std = TRUE, raw whenFALSE), plusmean(raw importance mean, always stored).$conditionalNULLwhenconditional = FALSE; otherwise a data frame with columnsvariable,class,z(one row per variable x class combination).
A "provenance" attribute carries family, local.std,
cutoff, faithful, conditional, xvar.names,
and n.
What varpro is doing
Permutation importance asks "what happens to OOB accuracy when I scramble this variable?" That works, but it leans on artificial data (the permuted column) and the answer can be unstable when variables are correlated. The varpro framework (Lu and Ishwaran, 2024) replaces permutation with release rules. The forest is grown with guided splitting; from a subset of trees varpro samples a collection of decision-rule branches; for each variable it then compares the response inside the rule's region to the response after the rule's constraint on that variable is "released". The size of that change, aggregated over many rules and trees, is the variable's importance. No synthetic covariates, no permutation: the contrast is between two real subsets of the data.
Because varpro builds importance from rules sampled over trees, every
tree contributes its own importance value for each variable. Those are
the per-tree scores we summarize here. With local.std = TRUE
(the default) the per-tree values are standardized by their column
standard deviation so the column mean equals the aggregate z-score
returned by varPro::importance(); that z-score is the canonical
"is this variable in or out?" statistic, and cutoff = 0.79 is
varpro's default selection threshold.
For a classification forest, varpro also returns a class-conditional
z table: the same importance computed restricting attention to rules
relevant to each class. conditional = TRUE keeps that table so
the plot method can show which variables matter for which class
rather than only in aggregate.
What's in the output
$imp is the one-row-per-variable summary: aggregate z from
varPro::importance(), plus a selected flag for
z > cutoff. $stats holds the box quantiles
(5/15/50/85/95 percentiles, plus the raw mean) computed from the
per-tree matrix; these are what the boxplot draws. $imp.tree
is the per-tree matrix itself, kept only when faithful = TRUE
so the plot method can scatter individual tree values over the box.
$conditional is the tidy class x variable z table, present
only when conditional = TRUE and the family is
classification.
What you use this for
rank candidate variables by importance and pick a working set above varpro's z cutoff;
see, via the boxplot's spread and the per-tree points (
faithful = TRUE), how stable each variable's importance is across trees: a high median with a wide box is a different story from a high median with a tight box;for a classification forest, ask which variables drive which class (
conditional = TRUE) rather than just which variables drive the model overall.
The z-score is a standardized ranking statistic, not a p-value or a
probability. Two variables with the same z are "similarly important
by this method", not "equally likely to be true signal". For a
data-driven cutoff rather than the 0.79 default, see
varPro::cv.varpro.
References
Lu, M. and Ishwaran, H. (2024). Model-independent variable selection via the rule-based variable priority framework. arXiv preprint arXiv:2409.09003.