Produces ggplot2 partial dependence curves from the named list returned by
gg_partialpro, which wraps varpro::partialpro output.
Arguments
- x
A
gg_partialproobject.- type
Character vector; one or more of
"parametric","nonparametric","causal". Defaults to all three.- ...
Not currently used.
Value
A single ggplot or a named list with continuous and
categorical elements when both types of predictors are present.
Details
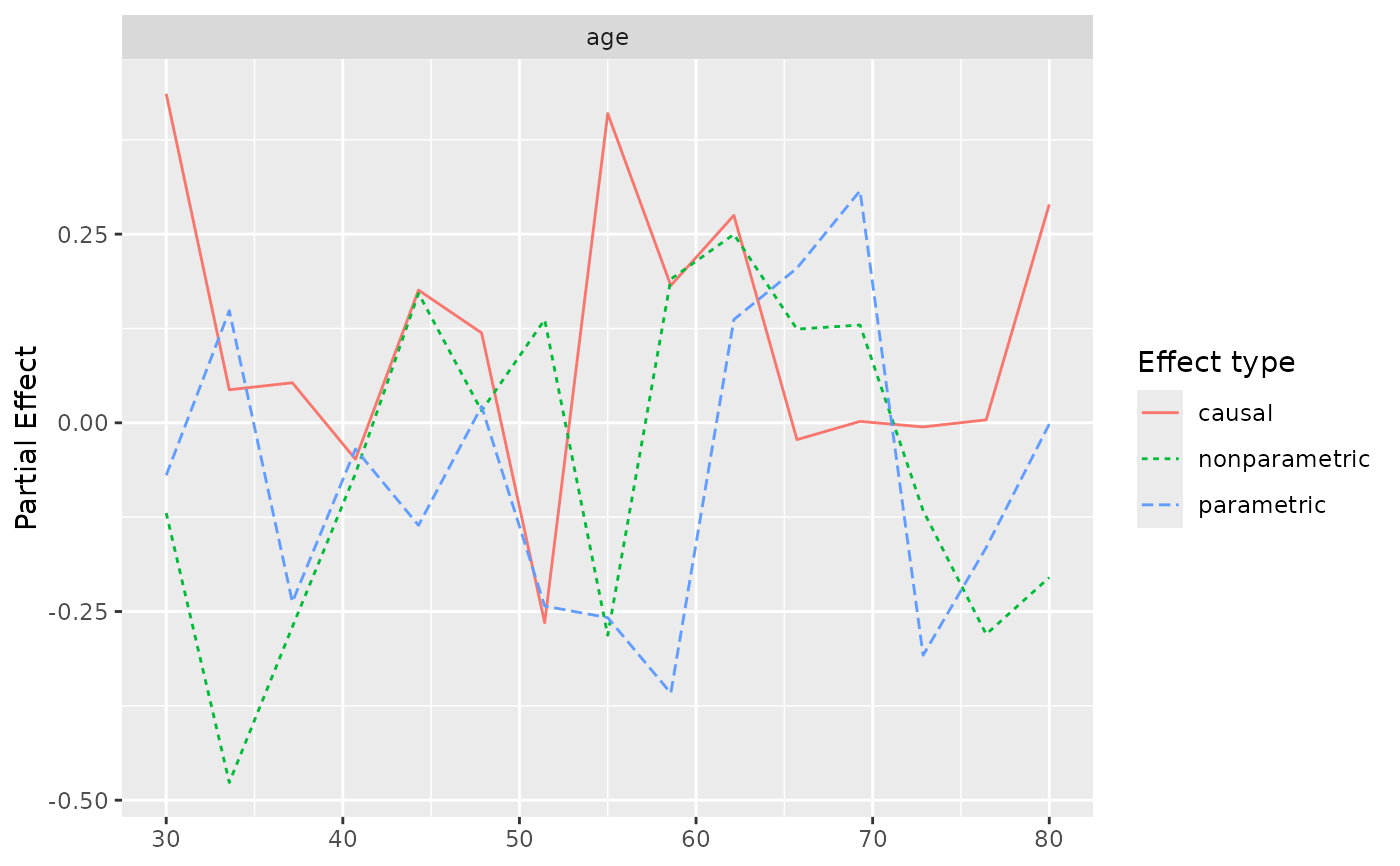
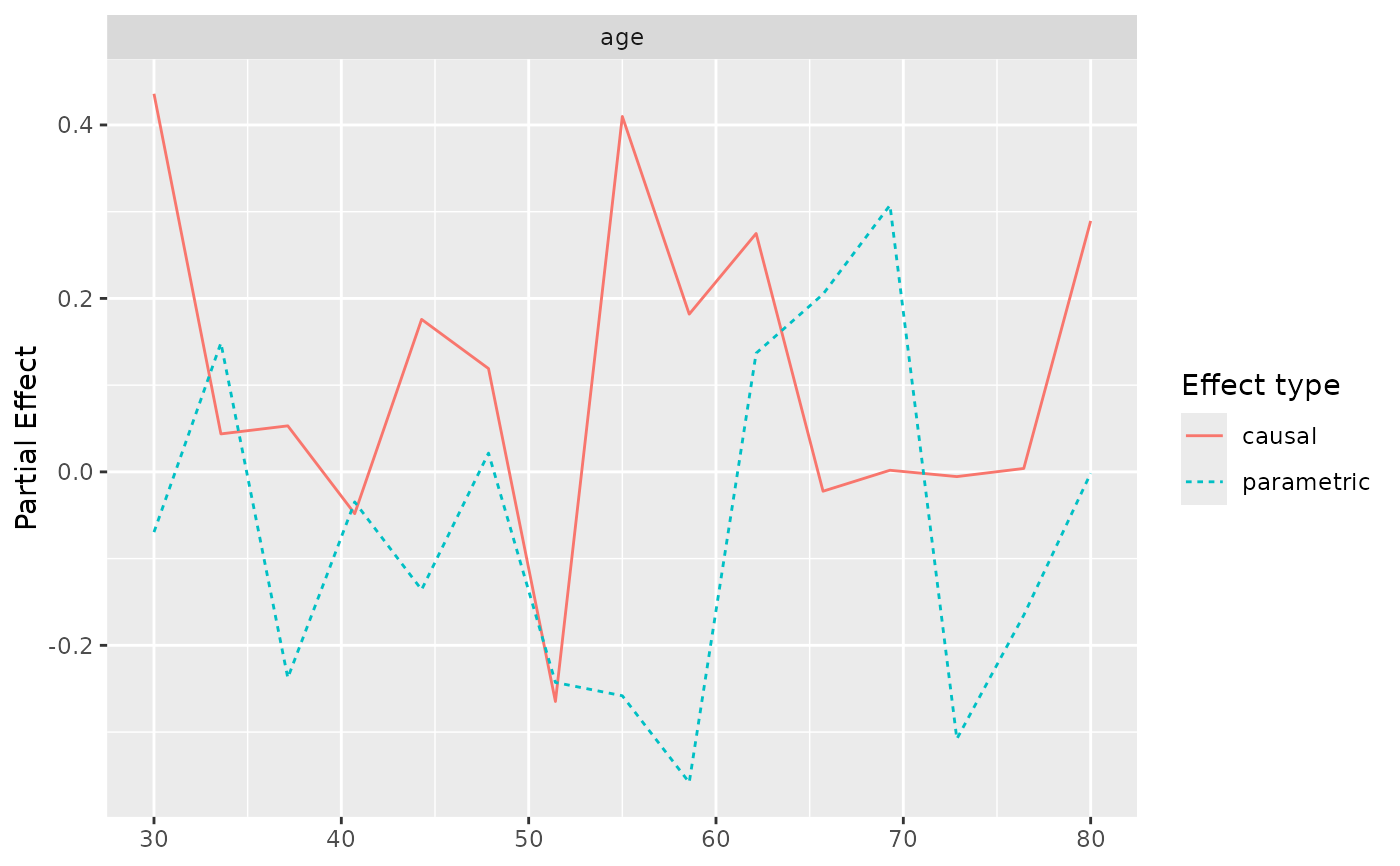
Each variable produces up to three effect curves: parametric, nonparametric,
and causal. The type argument controls which are shown.
Examples
## ggRandomForests does not depend on the varpro package; we construct a
## minimal mock of the partialpro() output so the example runs everywhere.
set.seed(42)
n_obs <- 30
n_pts <- 15
mock_data <- list(
age = list(
xvirtual = seq(30, 80, length.out = n_pts),
xorg = sample(seq(30, 80, by = 5), n_obs, replace = TRUE),
yhat.par = matrix(rnorm(n_obs * n_pts), nrow = n_obs),
yhat.nonpar = matrix(rnorm(n_obs * n_pts), nrow = n_obs),
yhat.causal = matrix(rnorm(n_obs * n_pts), nrow = n_obs)
),
sex = list(
xvirtual = c(0, 1),
xorg = sample(c(0, 1), n_obs, replace = TRUE),
yhat.par = matrix(rnorm(n_obs * 2), nrow = n_obs),
yhat.nonpar = matrix(rnorm(n_obs * 2), nrow = n_obs),
yhat.causal = matrix(rnorm(n_obs * 2), nrow = n_obs)
)
)
pp <- gg_partialpro(mock_data)
result <- plot(pp)
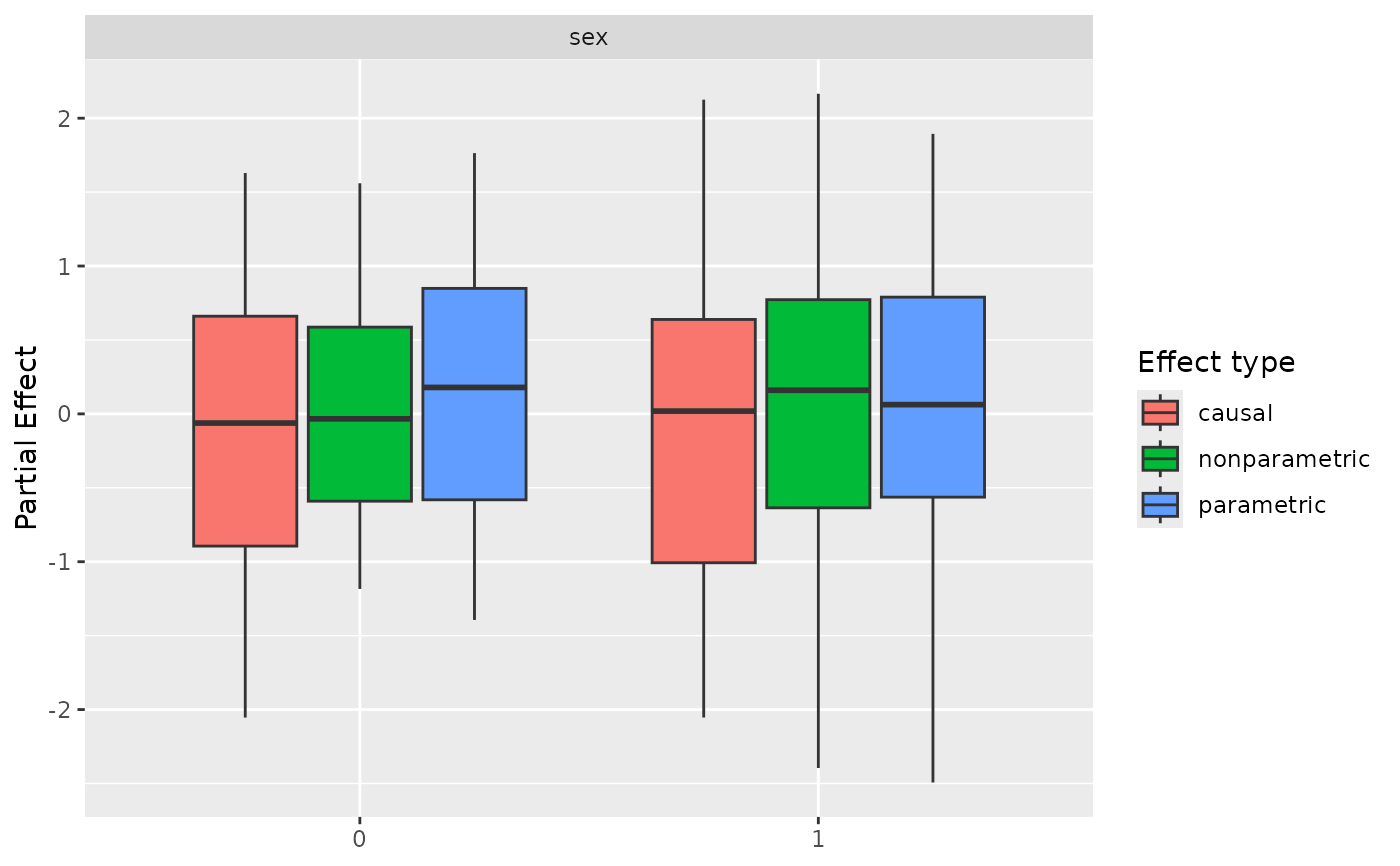
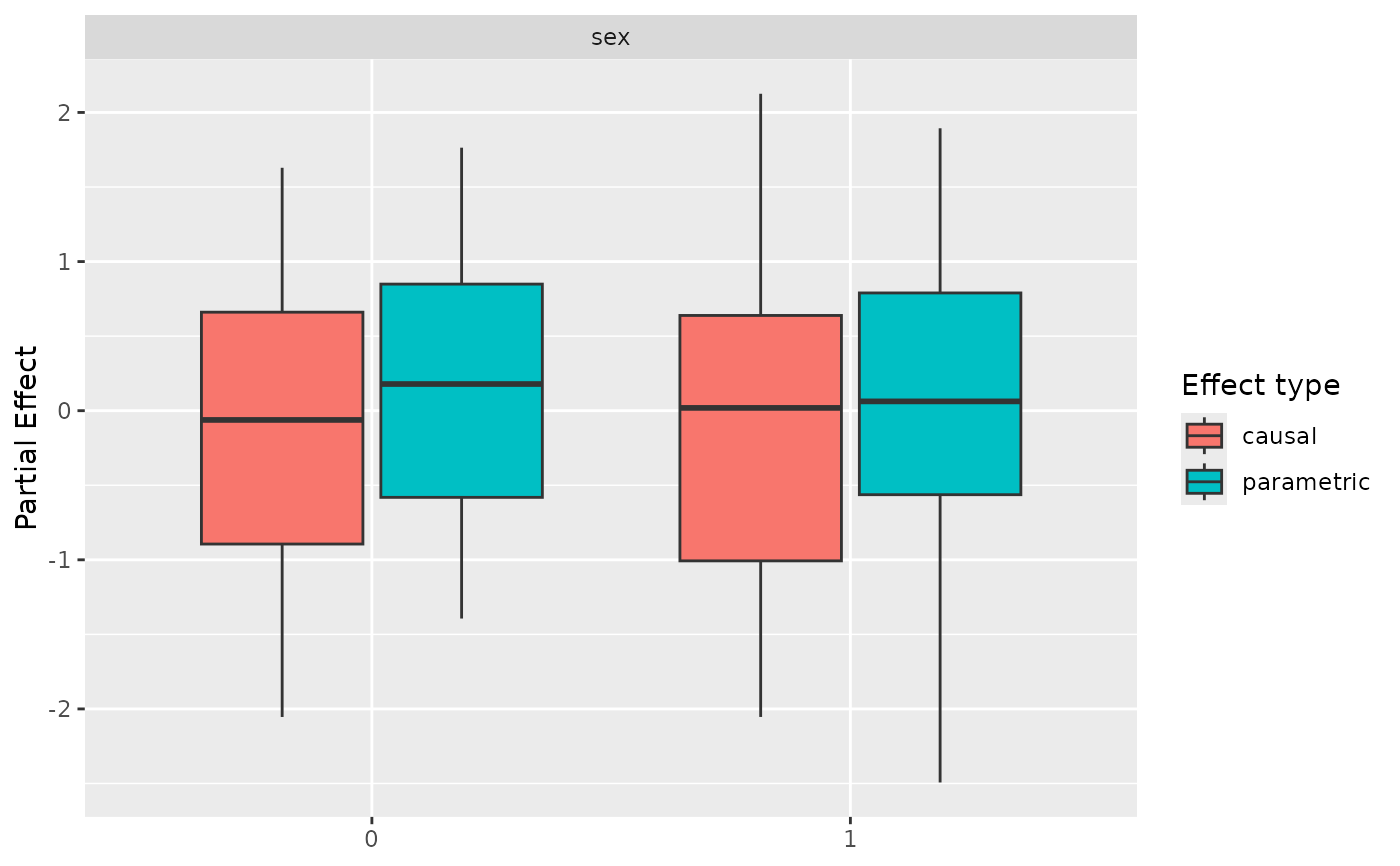
# Continuous predictors get one panel per variable; categorical get
# box-plots over the parametric / nonparametric / causal effect types.
result$continuous
 result$categorical
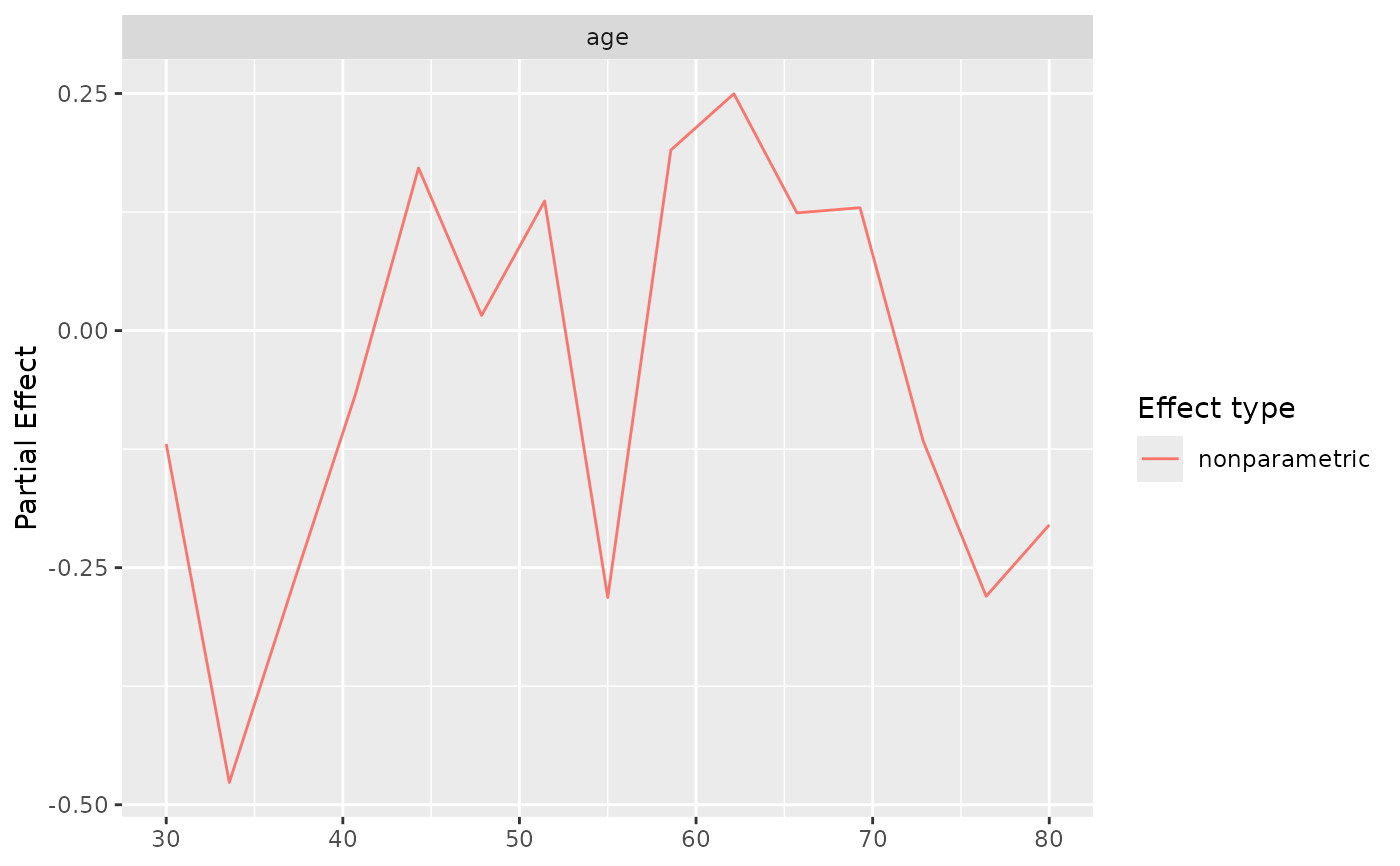
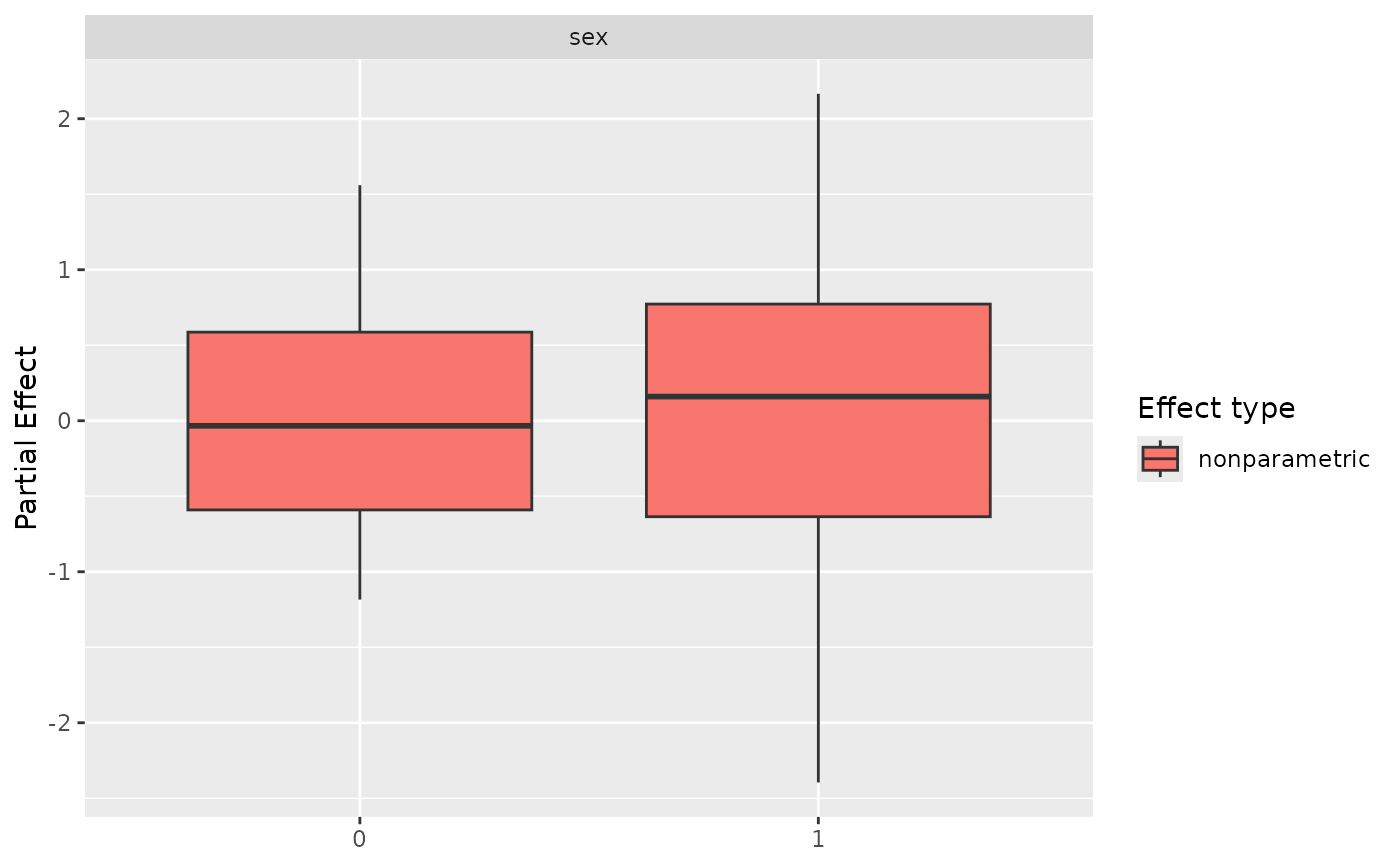
 # Restrict to one or two effect types
plot(pp, type = "nonparametric")
#> $continuous
# Restrict to one or two effect types
plot(pp, type = "nonparametric")
#> $continuous
 #>
#> $categorical
#>
#> $categorical
 #>
plot(pp, type = c("parametric", "causal"))
#> $continuous
#>
plot(pp, type = c("parametric", "causal"))
#> $continuous
 #>
#> $categorical
#>
#> $categorical
 #>
#>