ROC plot generic function for a gg_roc object.
Arguments
- x
A
gg_rocobject, or a rawrfsrcorrandomForestclassification forest. Hand it a forest andgg_rocis called for you.- which_outcome
Integer; for multi-class problems, the index of the class to plot. When
NULL(default) and the forest has more than two classes, the curves for all classes are overlaid in one plot. For binary forests,NULLdefaults to class index 2.- ...
Additional arguments passed to
gg_rocwhenxis a raw forest (e.g.oob = FALSE).- panel
Character; layout for per-class ROC objects, the ones from
gg_roc(..., per_class = TRUE)."overlay"(default) draws every class curve in one panel, colored by class;"facet"gives each class its own panel. Ignored for single-classgg_rocobjects.
Value
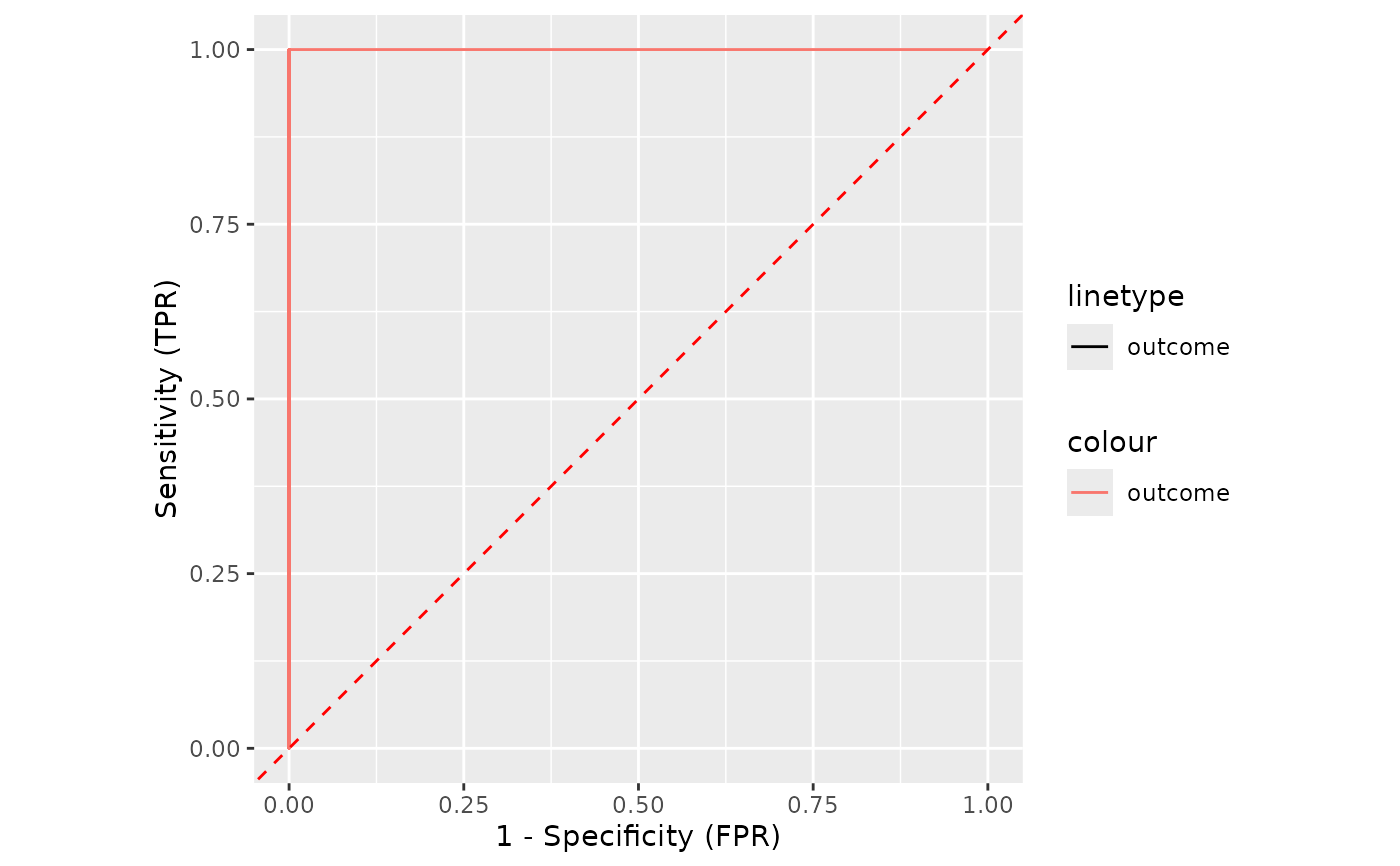
A ggplot object. The x-axis is 1 - Specificity (FPR), the
y-axis is Sensitivity (TPR), and a dashed red diagonal marks the
random-classifier baseline. Single-class curves carry the AUC as an
annotation; multi-class plots color and style each class curve
distinctly.
References
Breiman L. (2001). Random forests, Machine Learning, 45:5-32.
Ishwaran H. and Kogalur U.B. (2007). Random survival forests for R, Rnews, 7(2):25-31.
Ishwaran H. and Kogalur U.B. randomForestSRC: Random Forests for Survival, Regression and Classification. R package version >= 3.4.0. https://cran.r-project.org/package=randomForestSRC
Examples
## ------------------------------------------------------------
## classification example
## ------------------------------------------------------------
## -------- iris data
# Build a small classification forest (ntree=50 keeps example fast)
set.seed(42)
rfsrc_iris <- randomForestSRC::rfsrc(Species ~ ., data = iris, ntree = 50)
# ROC for setosa (outcome index 1)
gg_dta <- gg_roc(rfsrc_iris, which_outcome = 1)
plot(gg_dta)
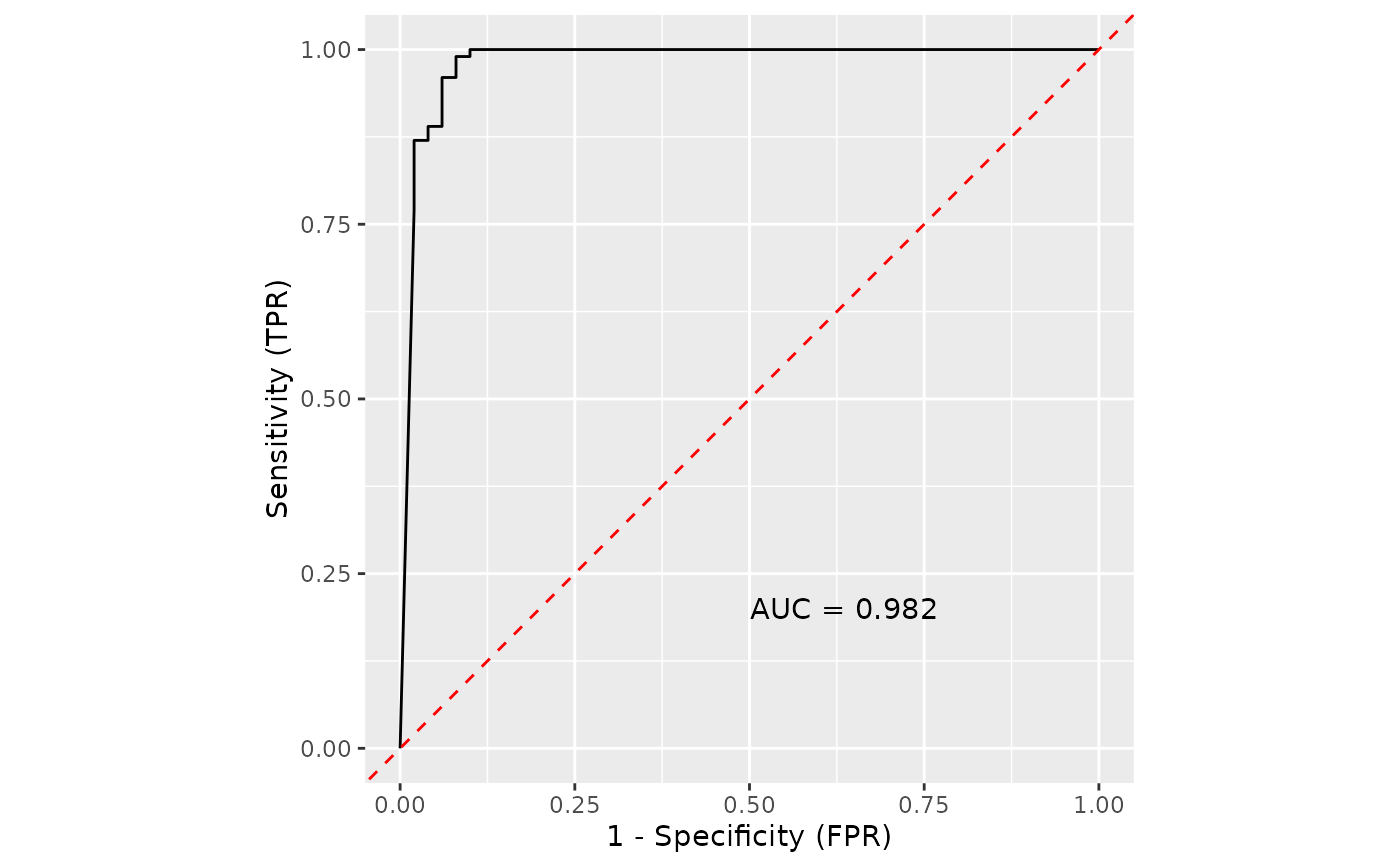
 # ROC for versicolor (outcome index 2)
gg_dta <- gg_roc(rfsrc_iris, which_outcome = 2)
plot(gg_dta)
# ROC for versicolor (outcome index 2)
gg_dta <- gg_roc(rfsrc_iris, which_outcome = 2)
plot(gg_dta)
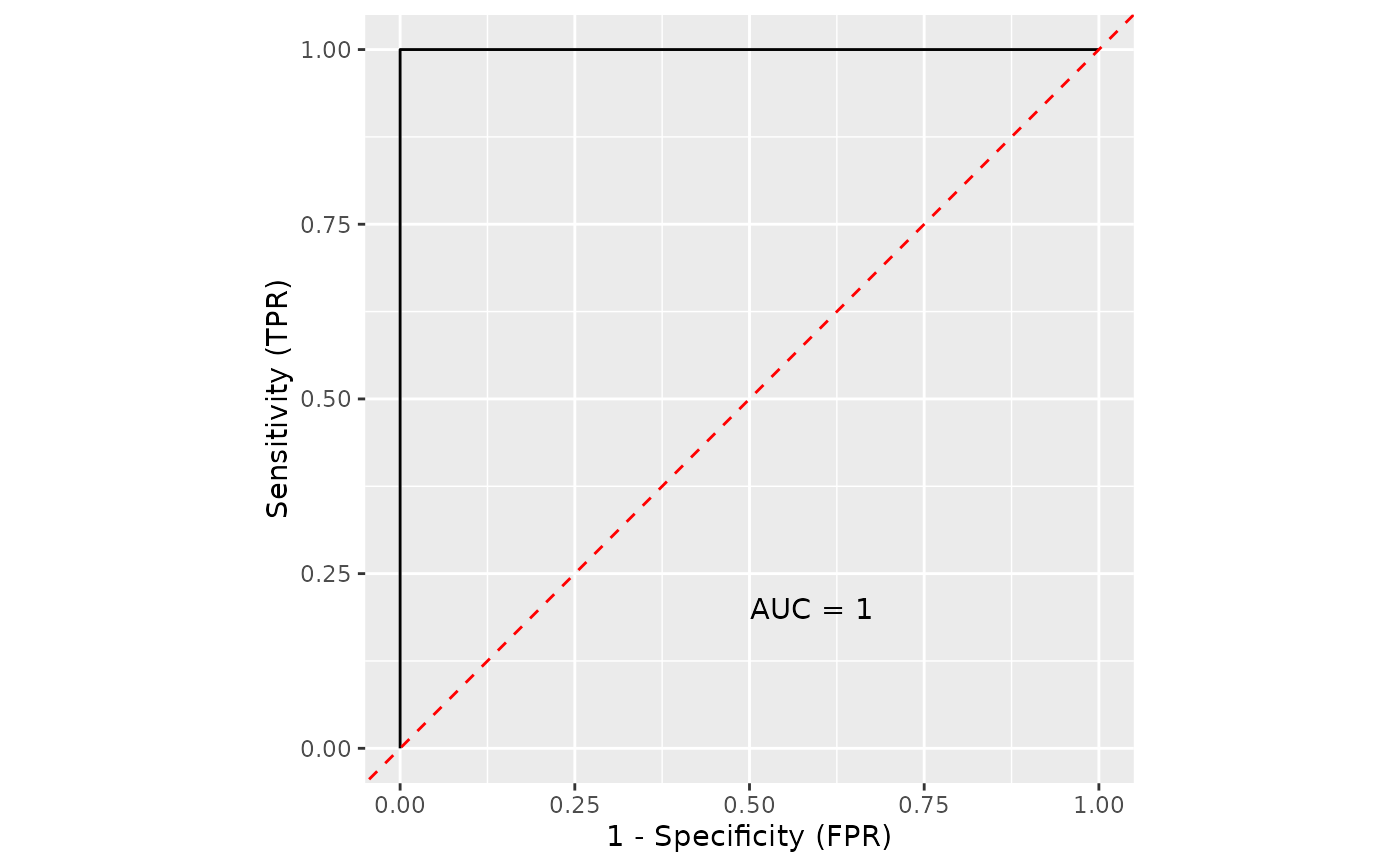
 # ROC for virginica (outcome index 3)
gg_dta <- gg_roc(rfsrc_iris, which_outcome = 3)
plot(gg_dta)
# ROC for virginica (outcome index 3)
gg_dta <- gg_roc(rfsrc_iris, which_outcome = 3)
plot(gg_dta)
 # Plot all three ROC curves in one call by iterating over outcome indices
n_cls <- ncol(rfsrc_iris$predicted)
for (i in seq_len(n_cls)) print(plot(gg_roc(rfsrc_iris, which_outcome = i)))
# Plot all three ROC curves in one call by iterating over outcome indices
n_cls <- ncol(rfsrc_iris$predicted)
for (i in seq_len(n_cls)) print(plot(gg_roc(rfsrc_iris, which_outcome = i)))