Plot a gg_vimp object, extracted variable importance of a rfsrc object
Source: R/plot.gg_vimp.R
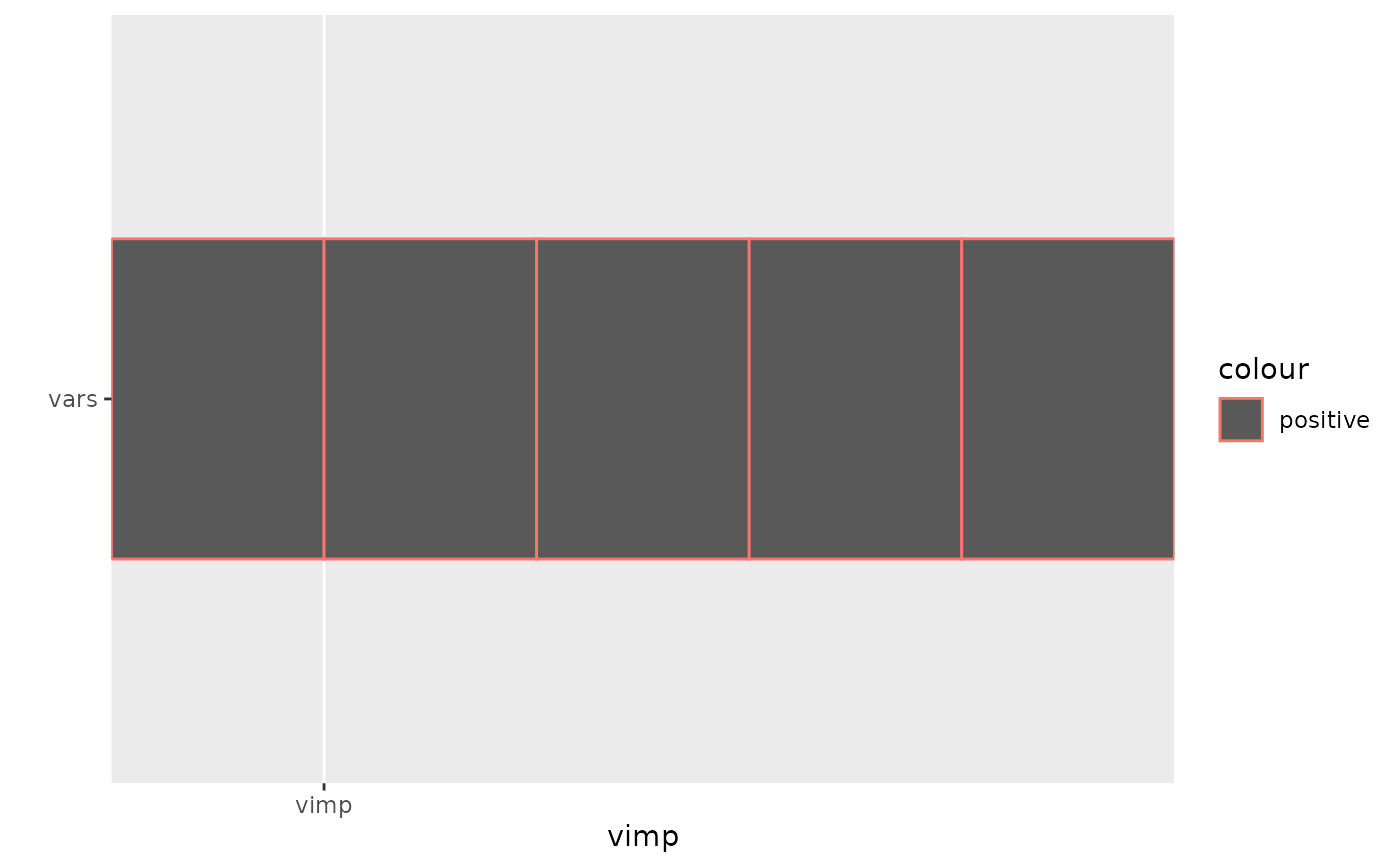
plot.gg_vimp.RdDraws a horizontal bar chart of the VIMP scores extracted by
gg_vimp. Each bar represents one predictor; bar length is
proportional to its permutation VIMP – the average rise in OOB prediction
error when that predictor's OOB values are randomly shuffled. Predictors
are sorted in descending order of importance so the most influential
variables appear at the top.
Usage
# S3 method for class 'gg_vimp'
plot(x, relative, lbls, ...)Details
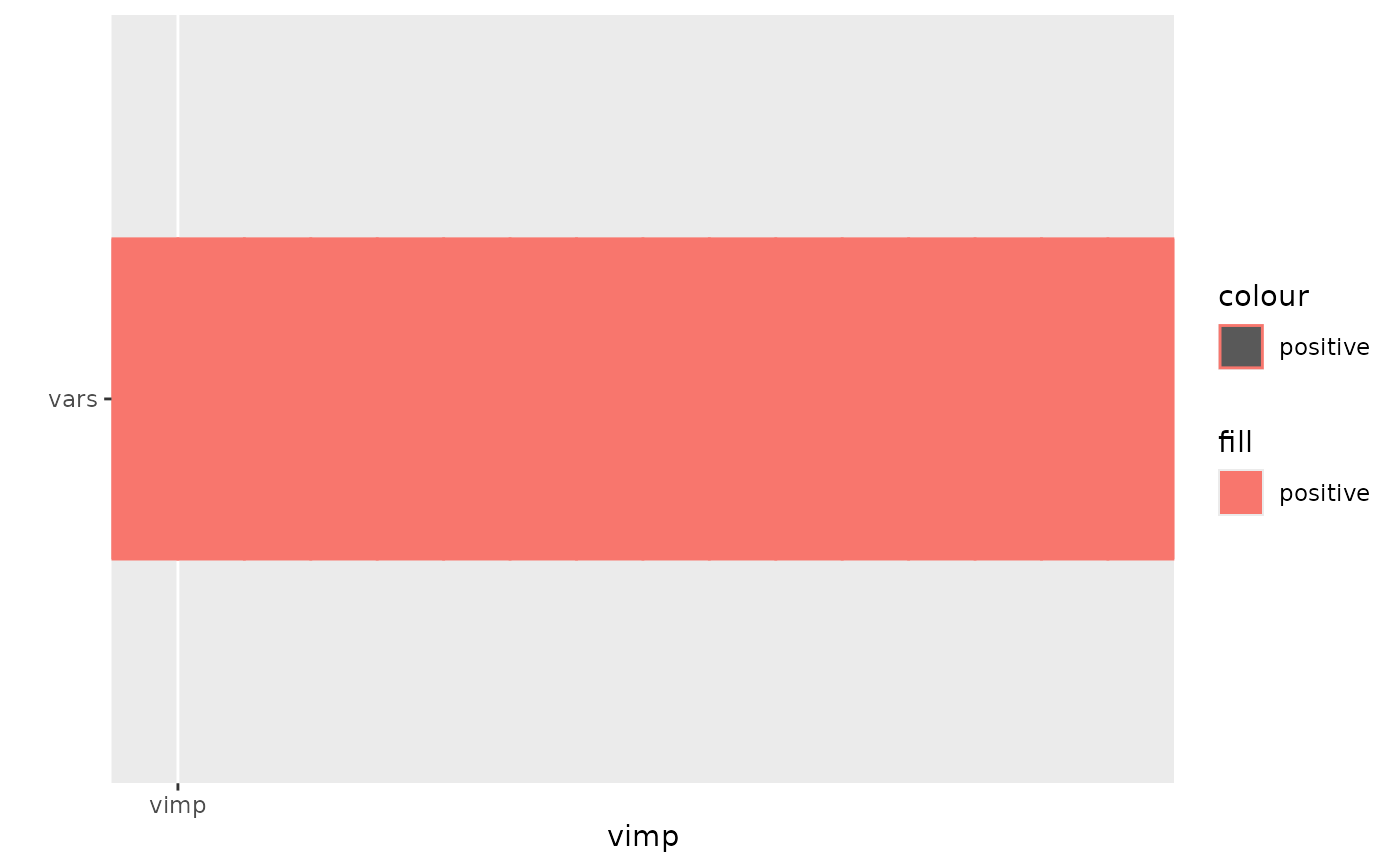
Bars are colored by the positive flag: a bar at or below zero
(non-positive VIMP) is color-coded differently to flag predictors that
hurt OOB accuracy when their signal is removed – usually a sign of
collinearity or a very noisy variable. In a well-behaved forest most bars
are positive; the color distinction matters when a handful are not.
References
Breiman L. (2001). Random forests, Machine Learning, 45:5-32.
Ishwaran H. and Kogalur U.B. (2007). Random survival forests for R, Rnews, 7(2):25-31.
Ishwaran H. and Kogalur U.B. randomForestSRC: Random Forests for Survival, Regression and Classification. R package version >= 3.4.0. https://cran.r-project.org/package=randomForestSRC
Examples
## ------------------------------------------------------------
## classification example
## ------------------------------------------------------------
## -------- iris data
rfsrc_iris <- randomForestSRC::rfsrc(Species ~ ., data = iris)
gg_dta <- gg_vimp(rfsrc_iris)
#> Warning: rfsrc object does not contain VIMP information. Calculating...
plot(gg_dta)


## ------------------------------------------------------------
## regression example
## ------------------------------------------------------------
## -------- air quality data
rfsrc_airq <- randomForestSRC::rfsrc(Ozone ~ ., airquality)
gg_dta <- gg_vimp(rfsrc_airq)
#> Warning: rfsrc object does not contain VIMP information. Calculating...
plot(gg_dta)
## ------------------------------------------------------------
## regression example
## ------------------------------------------------------------
## -------- air quality data
rfsrc_airq <- randomForestSRC::rfsrc(Ozone ~ ., airquality)
gg_dta <- gg_vimp(rfsrc_airq)
#> Warning: rfsrc object does not contain VIMP information. Calculating...
plot(gg_dta)