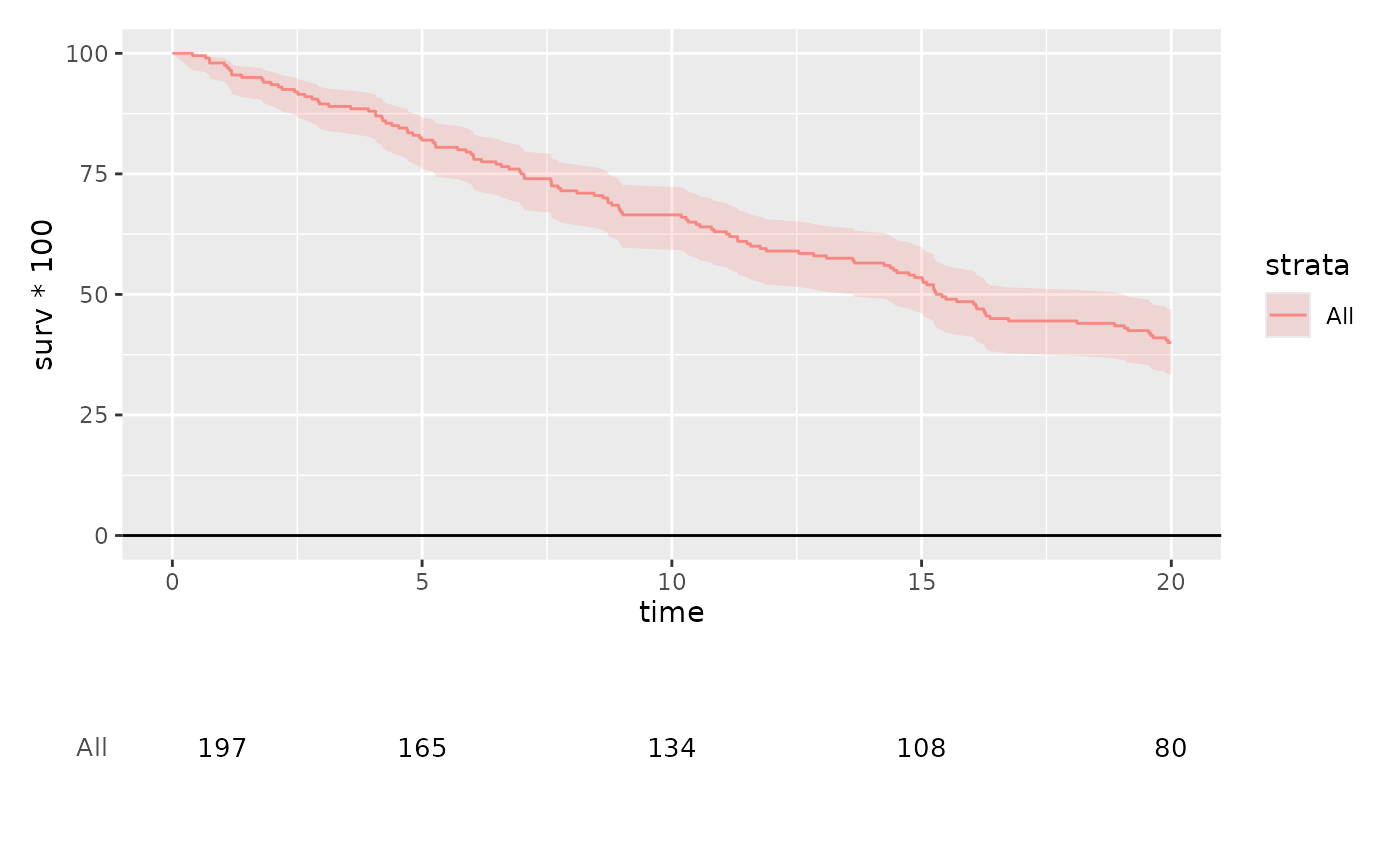
Composes a curve plot over a hv_atrisk panel, aligning the
table's x-range to the curve's so the counts sit under the matching times,
and stacks them with patchwork.
Usage
hv_atrisk_compose(curve, table, heights = c(3, 1))Arguments
- curve
A ggplot2 survival curve, e.g.
plot(hv_survival(...)).- table
A ggplot2 numbers-at-risk panel from
hv_atrisk.- heights
Numeric length-2 curve:table height ratio. Default
c(3, 1).
Value
A patchwork object (the curve above, the table below).
Decorate both panels with patchwork's &, e.g.
& theme_hv_manuscript().
Examples
km <- hv_survival(sample_survival_data(n = 200, seed = 1))
hv_atrisk_compose(plot(km), hv_atrisk(km))