Draws an exploratory data analysis plot for the variable stored in the
hv_eda object. Variable type (stored in x$meta$var_type)
determines the chart:
Usage
# S3 method for class 'hv_eda'
plot(
  x,
  smooth_method = "loess",
  smooth_span = 0.8,
  smooth_se = FALSE,
  loess_cutoff = 10,
  group_bars = FALSE,
  alpha = 0.4,
  ...
)
Arguments
- x
An
hv_edaobject.- smooth_method
Smoothing method for continuous plots, passed to
geom_smooth. Default"loess".- smooth_span
LOESS span. Default
0.8.- smooth_se
Logical; show confidence ribbon around smooth? Default
FALSE.- loess_cutoff
Integer, if the y-variable has less unique values than this, the smooth line will not be plotted. Default
10.- group_bars
Logical; Plot as grouped bars instead of stacked? Default
FALSE.- alpha
Point transparency for continuous plots. Default
0.4.- ...
Ignored; present for S3 consistency.
Value
A bare ggplot object.
Details
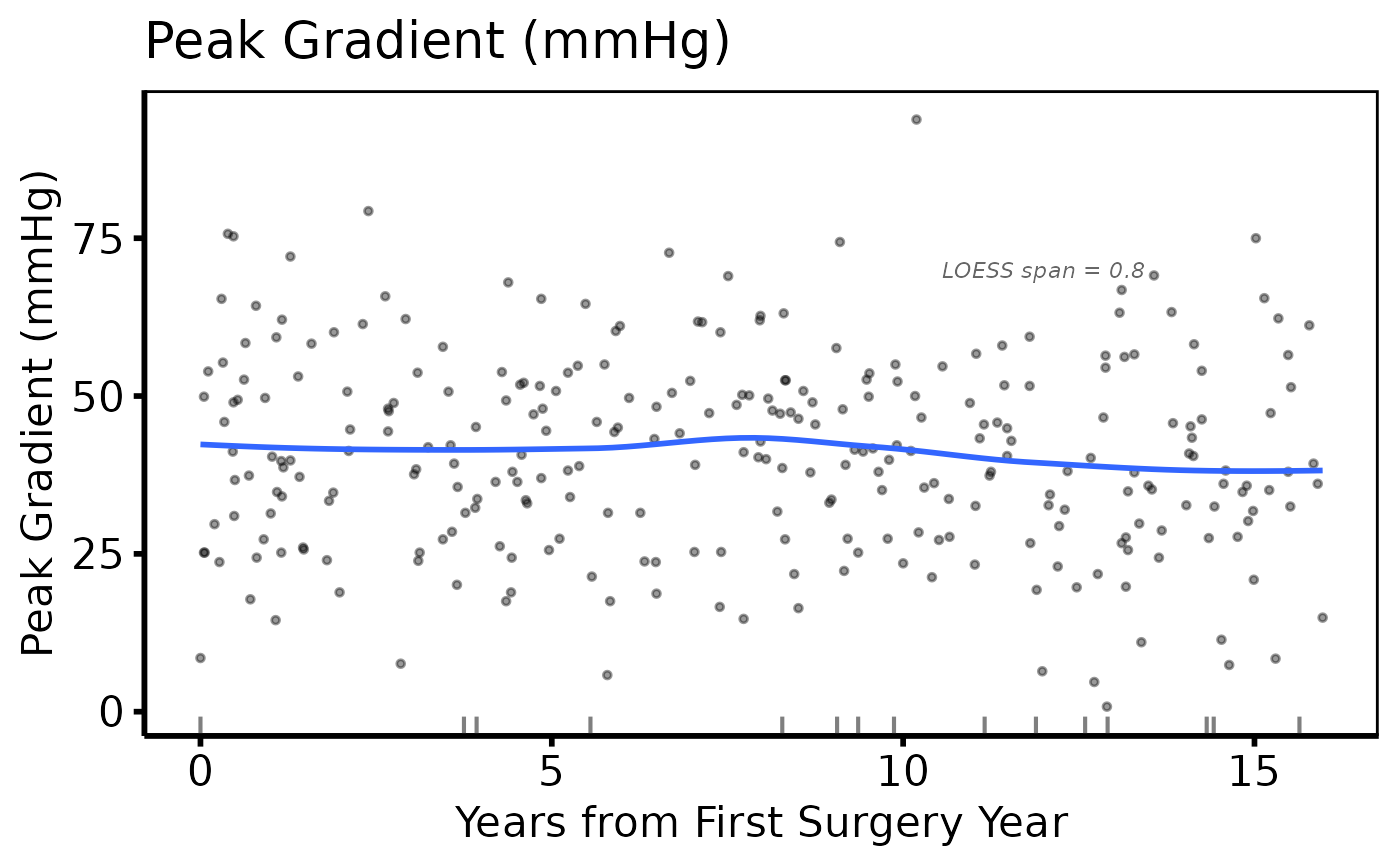
- Continuous (
"Cont") Scatter plot with a LOESS smoother overlay and a rug on the x-axis for rows where the outcome is missing.
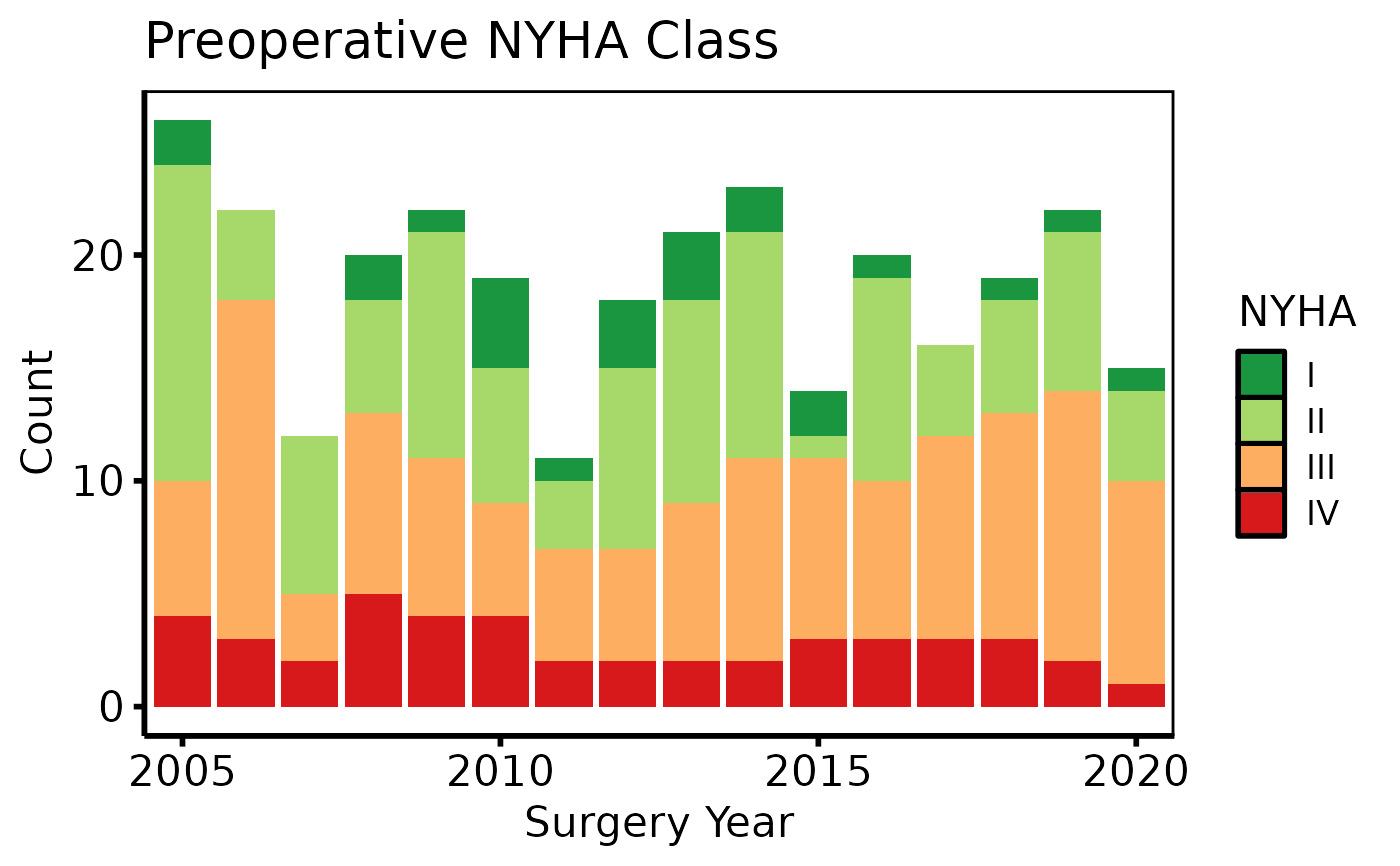
- Numeric categorical (
"Cat_Num") Stacked (or filled) bar chart with counts (or proportions) per x level.
- Character categorical (
"Cat_Char") Same stacked bar, coloring each string level separately.
Examples
dta <- sample_eda_data(n = 300, seed = 42)
# --- Ordinal categorical: percentage barplot ------------------------------
plot(hv_eda(dta, x_col = "year", y_col = "nyha",
y_label = "Preoperative NYHA Class")) +
ggplot2::scale_fill_brewer(
palette = "RdYlGn", direction = -1,
labels = c("1" = "I", "2" = "II", "3" = "III", "4" = "IV",
"(Missing)" = "Missing"),
name = "NYHA"
) +
ggplot2::scale_x_discrete(breaks = seq(2005, 2020, 5)) +
ggplot2::labs(x = "Surgery Year", y = "Count") +
theme_hv_poster()
 # --- Continuous: annotated -----------------------------------------------
plot(hv_eda(dta, x_col = "op_years", y_col = "peak_grad",
y_label = "Peak Gradient (mmHg)")) +
ggplot2::scale_color_manual(values = c("steelblue"), guide = "none") +
ggplot2::scale_x_continuous(breaks = seq(0, 15, 5)) +
ggplot2::labs(x = "Years from First Surgery Year") +
ggplot2::annotate("text", x = 12, y = 70,
label = "LOESS span = 0.8",
size = 3, color = "gray40", fontface = "italic") +
theme_hv_poster()
# --- Continuous: annotated -----------------------------------------------
plot(hv_eda(dta, x_col = "op_years", y_col = "peak_grad",
y_label = "Peak Gradient (mmHg)")) +
ggplot2::scale_color_manual(values = c("steelblue"), guide = "none") +
ggplot2::scale_x_continuous(breaks = seq(0, 15, 5)) +
ggplot2::labs(x = "Years from First Surgery Year") +
ggplot2::annotate("text", x = 12, y = 70,
label = "LOESS span = 0.8",
size = 3, color = "gray40", fontface = "italic") +
theme_hv_poster()