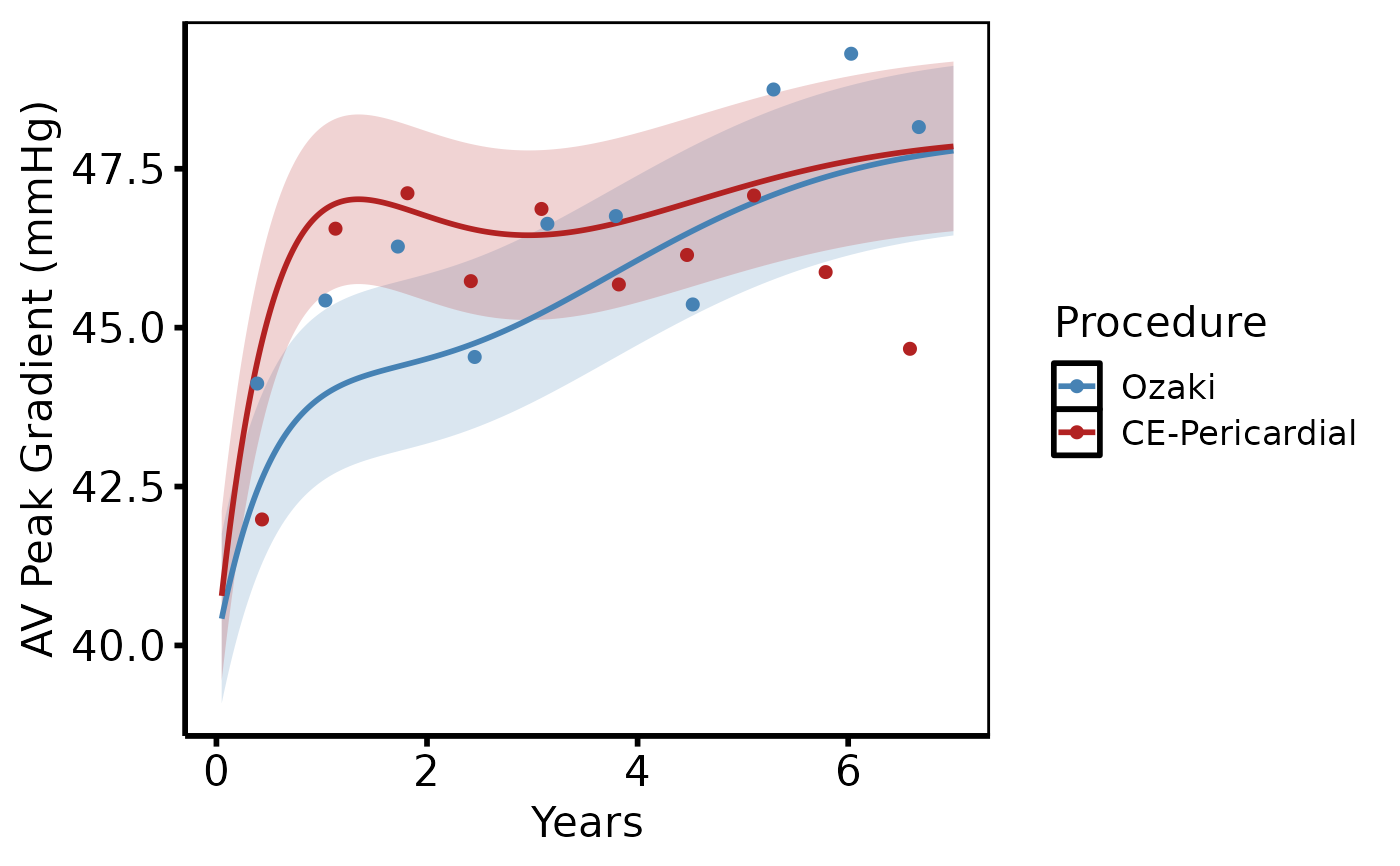
Draws a smooth predicted curve with optional CI ribbon and binned data summary point overlay.
Usage
# S3 method for class 'hv_nonparametric'
plot(
  x,
  ci_alpha = 0.2,
  line_width = 1,
  point_size = 2.5,
  point_shape = 20L,
  ...
)
Arguments
- x
An
hv_nonparametricobject.- ci_alpha
Transparency of the confidence ribbon. Default
0.2.- line_width
Width of the predicted curve line. Default
1.0.- point_size
Size of binned data summary points. Default
2.5.- point_shape
Integer shape code for data summary points. Default
20(filled circle).- ...
Ignored; present for S3 consistency.
Value
A bare ggplot object; compose with +
to add scales, axis limits, labels, and theme_hv_manuscript.
See also
hv_nonparametric to build the data object,
theme_hv_manuscript for the publication theme.
Other Nonparametric curves:
hv_nonparametric()
Examples
dat_two <- sample_nonparametric_curve_data(
  n = 400, time_max = 7,
  groups = c("Ozaki" = 0.7, "CE-Pericardial" = 1.3),
  outcome_type = "continuous"
)
dat_two_pts <- sample_nonparametric_curve_points(
  n = 400, time_max = 7,
  groups = c("Ozaki" = 0.7, "CE-Pericardial" = 1.3),
  outcome_type = "continuous"
)
np <- hv_nonparametric(dat_two, group_col = "group",
                          lower_col = "lower", upper_col = "upper",
                          data_points = dat_two_pts)
plot(np) +
  ggplot2::scale_colour_manual(
    values = c("Ozaki" = "steelblue", "CE-Pericardial" = "firebrick"),
    name = "Procedure"
  ) +
  ggplot2::scale_fill_manual(
    values = c("Ozaki" = "steelblue", "CE-Pericardial" = "firebrick"),
    guide  = "none"
  ) +
  ggplot2::labs(x = "Years", y = "AV Peak Gradient (mmHg)") +
  theme_hv_poster()