Draws a stacked (or proportional fill) histogram for the grouped numeric
variable stored in the hv_stacked object.
Usage
# S3 method for class 'hv_stacked'
plot(x, ...)Value
A bare ggplot object. Add scales, labels,
and themes with the usual + operator.
Examples
dta <- sample_stacked_histogram_data()
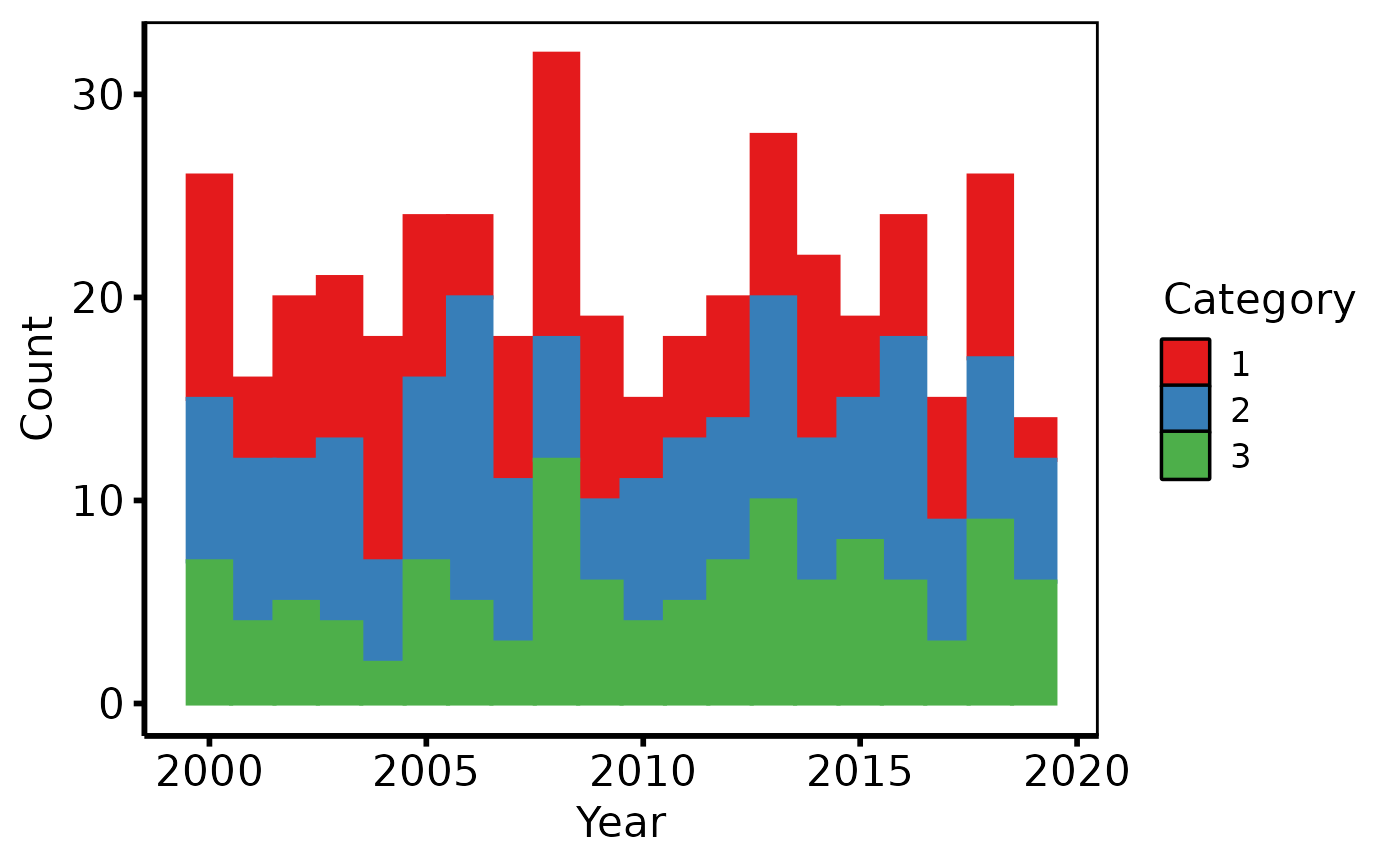
# Count histogram
plot(hv_stacked(dta, x_col = "year", group_col = "category")) +
ggplot2::scale_fill_brewer(palette = "Set1", name = "Category") +
ggplot2::scale_color_brewer(palette = "Set1", name = "Category") +
ggplot2::labs(x = "Year", y = "Count") +
theme_hv_poster()
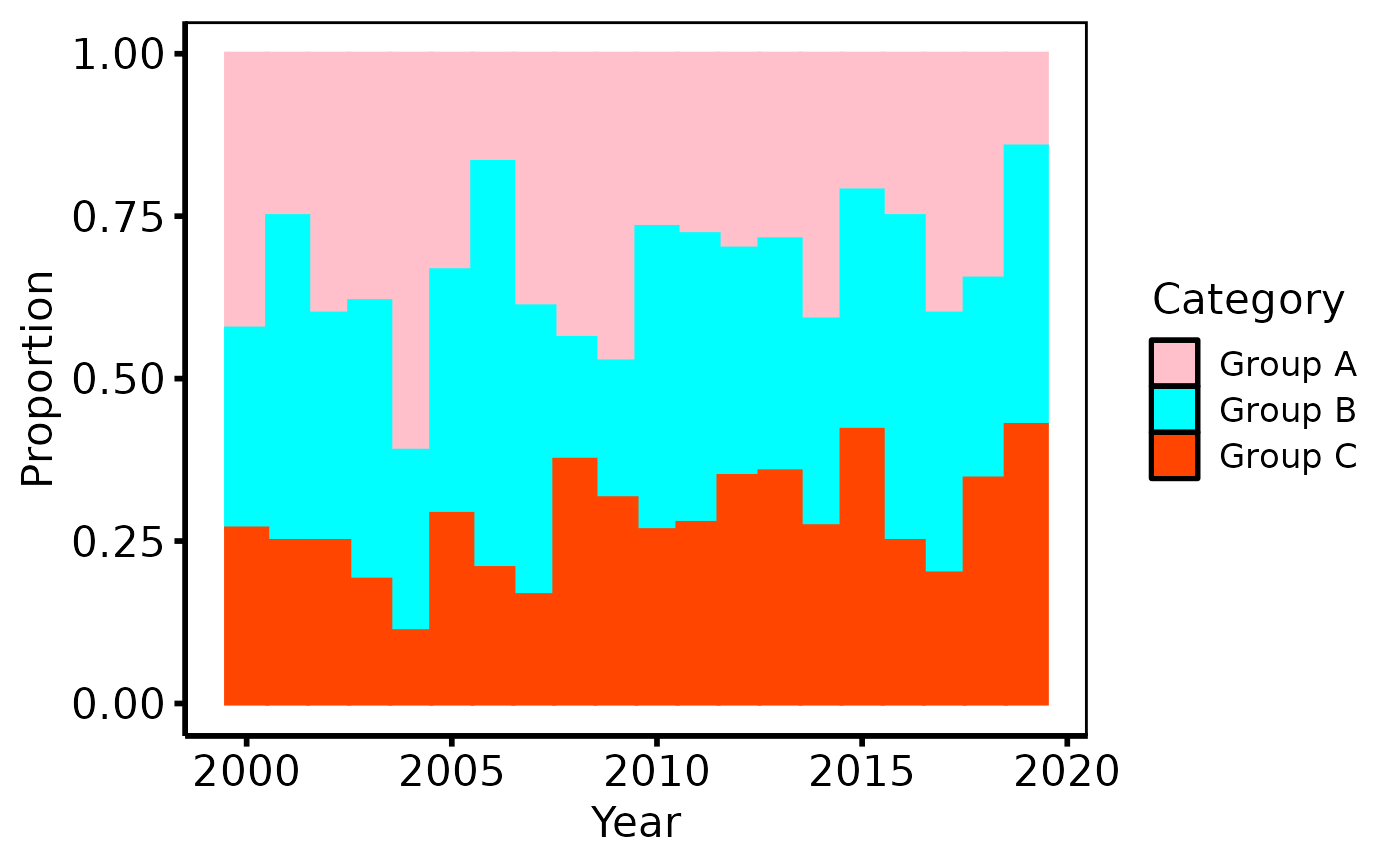
 # Proportional (fill) histogram with manual colours
plot(hv_stacked(dta, x_col = "year", group_col = "category",
position = "fill")) +
ggplot2::scale_fill_manual(
values = c("1" = "pink", "2" = "cyan", "3" = "orangered"),
labels = c("1" = "Group A", "2" = "Group B", "3" = "Group C"),
name = "Category"
) +
ggplot2::scale_color_manual(
values = c("1" = "pink", "2" = "cyan", "3" = "orangered"),
guide = "none"
) +
ggplot2::labs(x = "Year", y = "Proportion") +
theme_hv_poster()
# Proportional (fill) histogram with manual colours
plot(hv_stacked(dta, x_col = "year", group_col = "category",
position = "fill")) +
ggplot2::scale_fill_manual(
values = c("1" = "pink", "2" = "cyan", "3" = "orangered"),
labels = c("1" = "Group A", "2" = "Group B", "3" = "Group C"),
name = "Category"
) +
ggplot2::scale_color_manual(
values = c("1" = "pink", "2" = "cyan", "3" = "orangered"),
guide = "none"
) +
ggplot2::labs(x = "Year", y = "Proportion") +
theme_hv_poster()