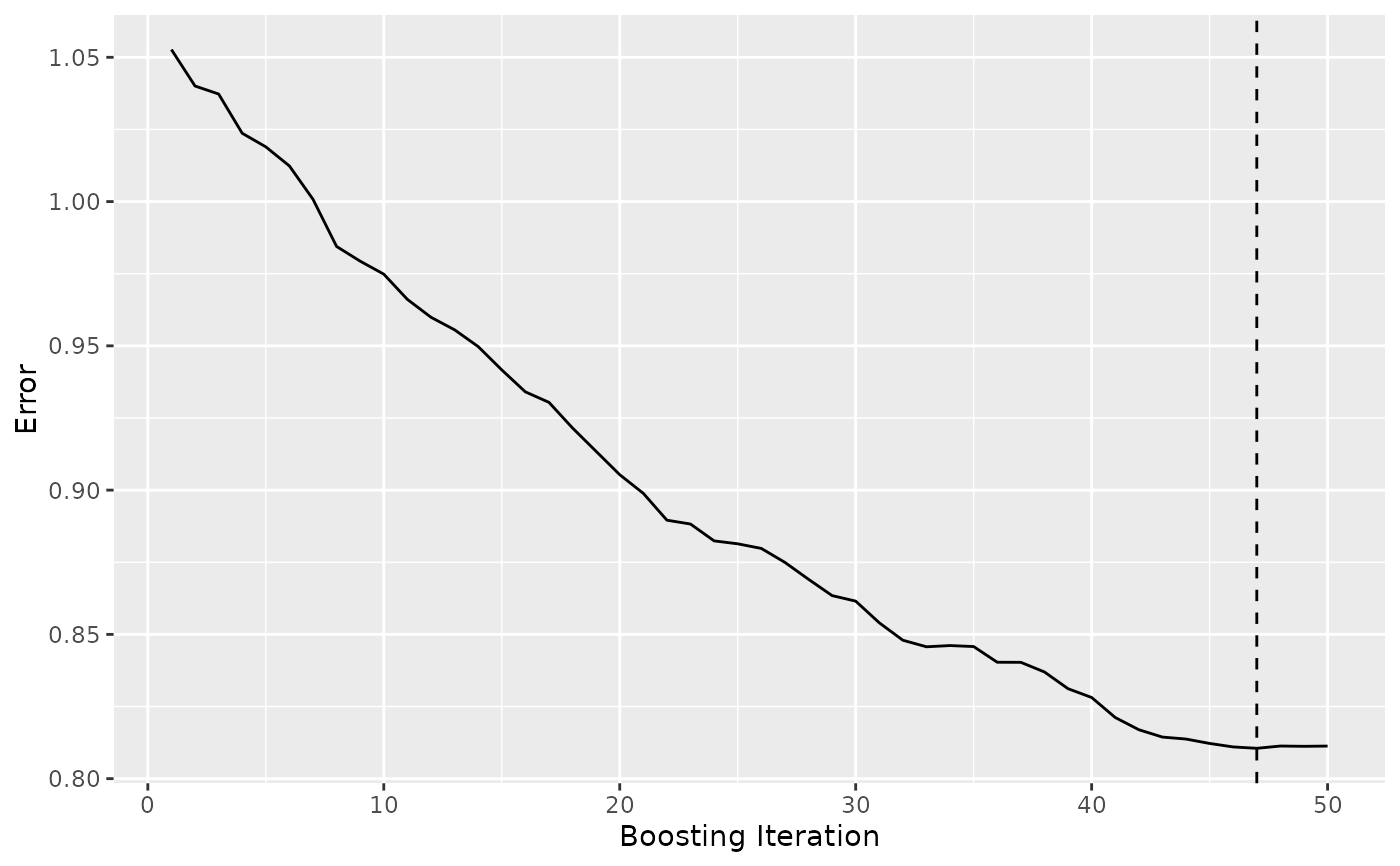
A shortcut to the error trajectory, which is the first thing worth looking
at after a fit. Every other figure is reached through its own
gg_boost_*() extractor.
Arguments
- object
A fitted
boostmtreeobject grown withcv.flag = TRUE.- ...
Passed to
autoplot.gg_boost_error.
Value
A ggplot object, as produced by
autoplot.gg_boost_error.
Examples
# \donttest{
sim <- boostmtree::simLong(n = 25, n.time = 4, model = 1)$data.list
fit <- boostmtree::boostmtree(
x = sim$features, tm = sim$time, id = sim$id, y = sim$y,
M = 50, cv.flag = TRUE, verbose = FALSE
)
ggplot2::autoplot(fit)
 # }