Routes to one of three SHAP views. type = "beeswarm" (default) draws
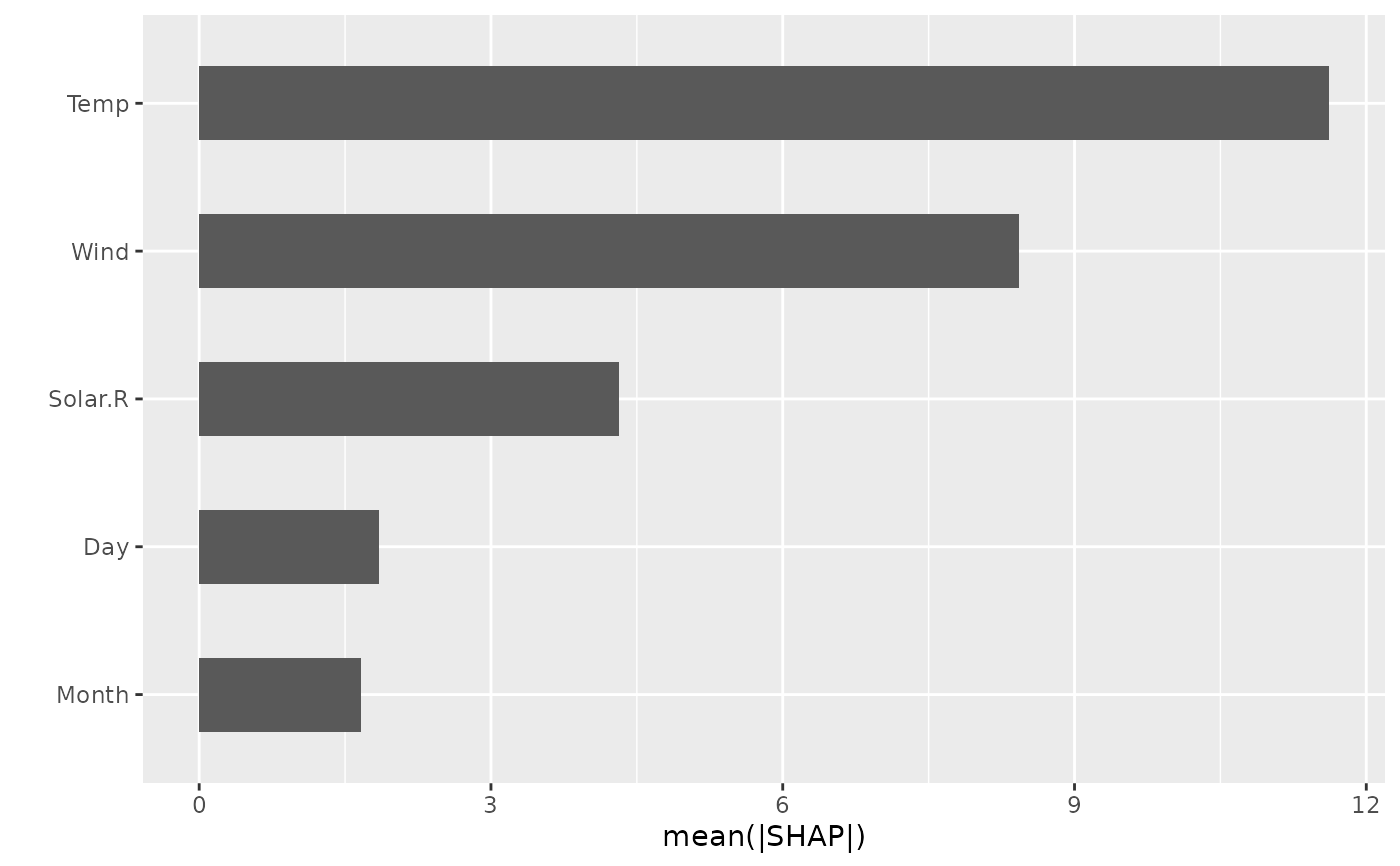
the signature SHAP summary; "importance" draws a mean-absolute-SHAP
bar chart; "dependence" draws SHAP value against a single feature's
value.
Arguments
- x
A
gg_shapobject.- type
One of
"beeswarm","importance", or"dependence".- xvar
For
type = "dependence", the variable to plot. WhenNULL, the top-ranked variable is used.- labels
Optional variable labels, forwarded to the mode function. One of: a named character vector (
c(Temp = "Temperature")); a labelled data frame, whoseattr(col, "label")values are read; or a two-columnkey/labeldata frame. Variables with no label keep their raw name. In"dependence"mode the label is substituted into the axis titles;xvarstill matches on raw names.- ...
Passed to the underlying builder.
Examples
# \donttest{
if (requireNamespace("kernelshap", quietly = TRUE)) {
rf <- randomForestSRC::rfsrc(Ozone ~ ., data = na.omit(airquality),
ntree = 50)
gg_dta <- gg_shap(rf, bg_n = 20)
plot(gg_dta, type = "importance")
}
 # }
# }