Draws a Kaplan-Meier (or Nelson-Aalen) survival curve from a
gg_survival object. You can overlay a confidence envelope
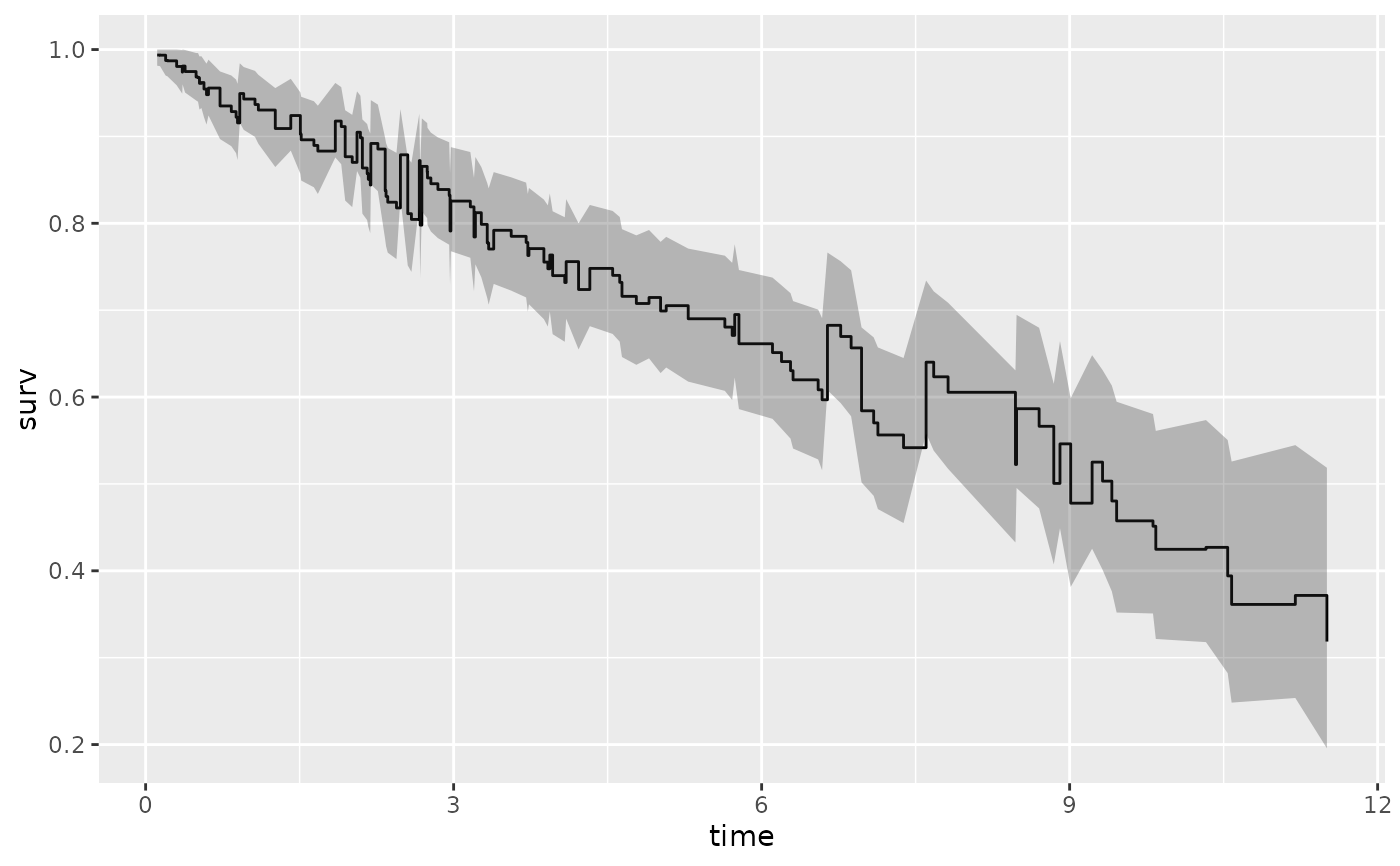
around the curve using error: "shade" fills the area between
the pointwise confidence limits, "lines" draws them as dashed step
functions, and "bars" shows them as error bars. When gg_survival
was called with a by argument, each group gets its own step function
and the label argument renames the legend.
Arguments
- x
gg_survivalor a survivalgg_rfsrcobject created from arfsrcobject- type
"surv", "cum_haz", "hazard", "density", "mid_int", "life", "proplife"
- error
"shade", "bars", "lines" or "none"
- label
Modify the legend label when gg_survival has stratified samples
- ...
Additional arguments forwarded to
geom_step(). Whenalphais supplied it is passed to the step geom and a halved value is used for the ribbon overlay.
Value
A ggplot object. The y-axis shows the chosen type
(e.g. survival probability for "surv") and the x-axis shows time.
Confidence shading, bars, or lines are added when the input object carries
confidence-interval columns.
Details
The type argument selects which quantity to plot on the y-axis –
survival probability ("surv") is the default, but cumulative hazard,
density, and several transformed scales are available for the cases where a
linear scale reveals more about the tails.
Examples
## -------- pbc data
data(pbc, package = "randomForestSRC")
pbc$time <- pbc$days / 364.25
# This is the same as kaplan
gg_dta <- gg_survival(
interval = "time", censor = "status",
data = pbc
)
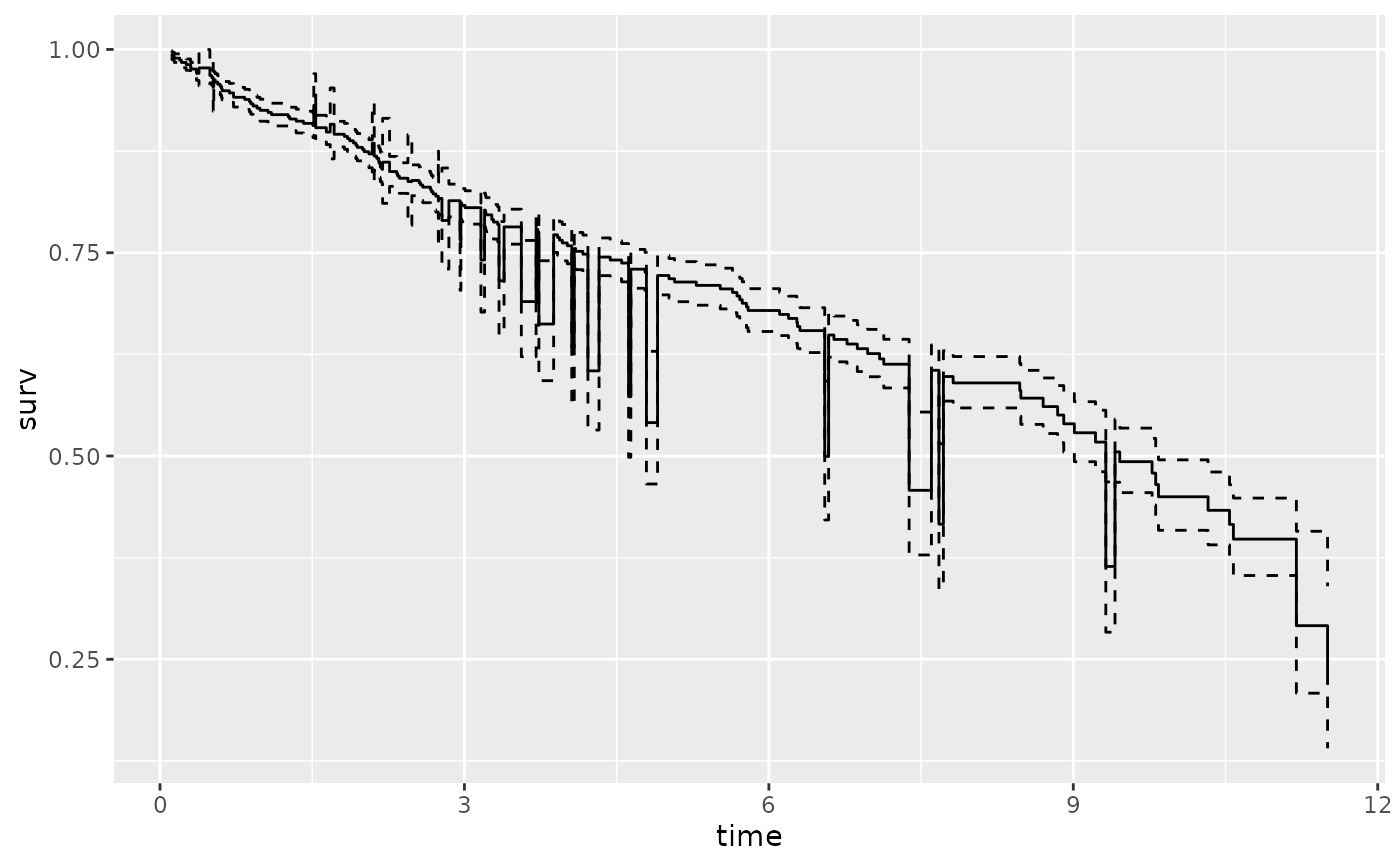
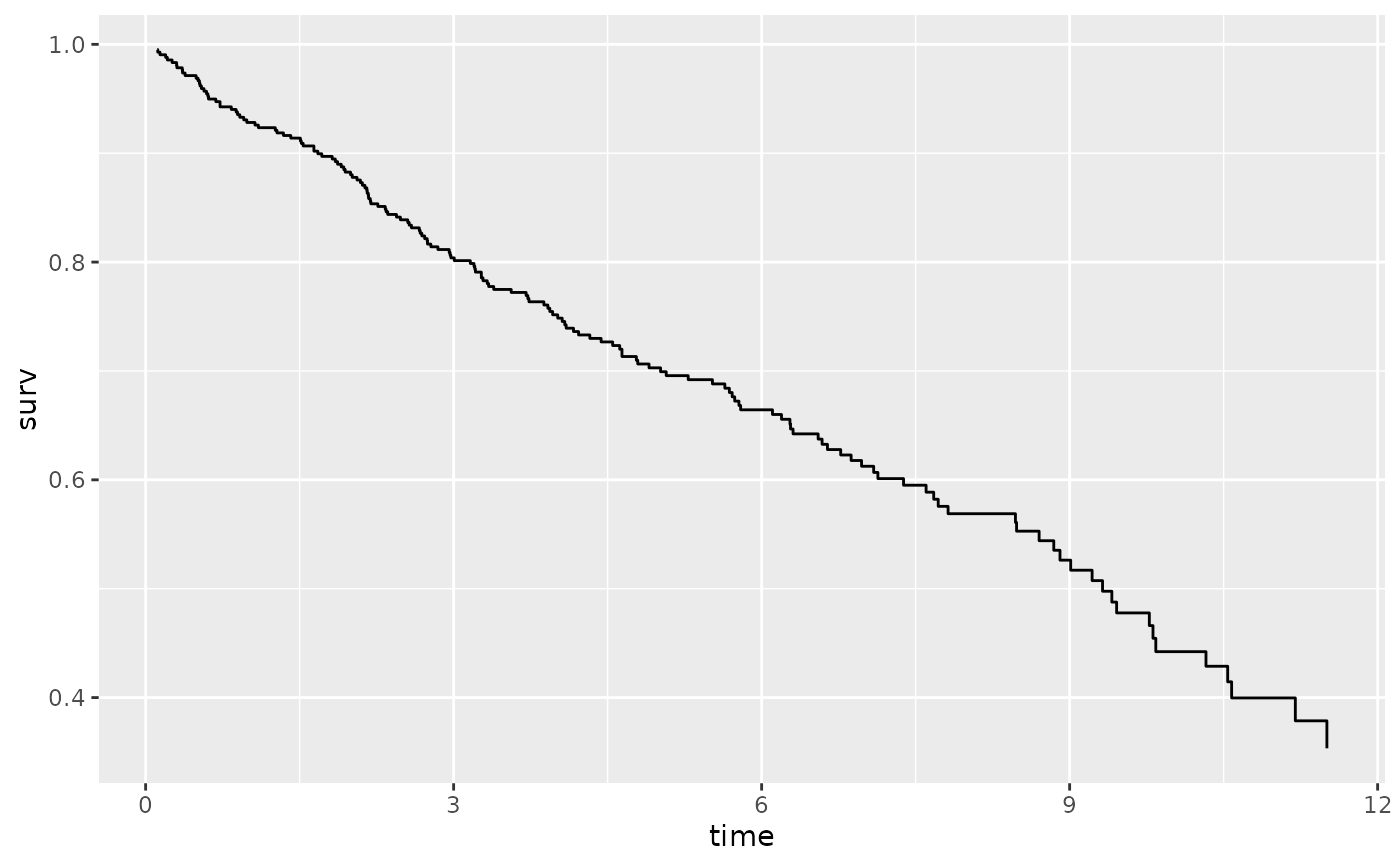
plot(gg_dta, error = "none")
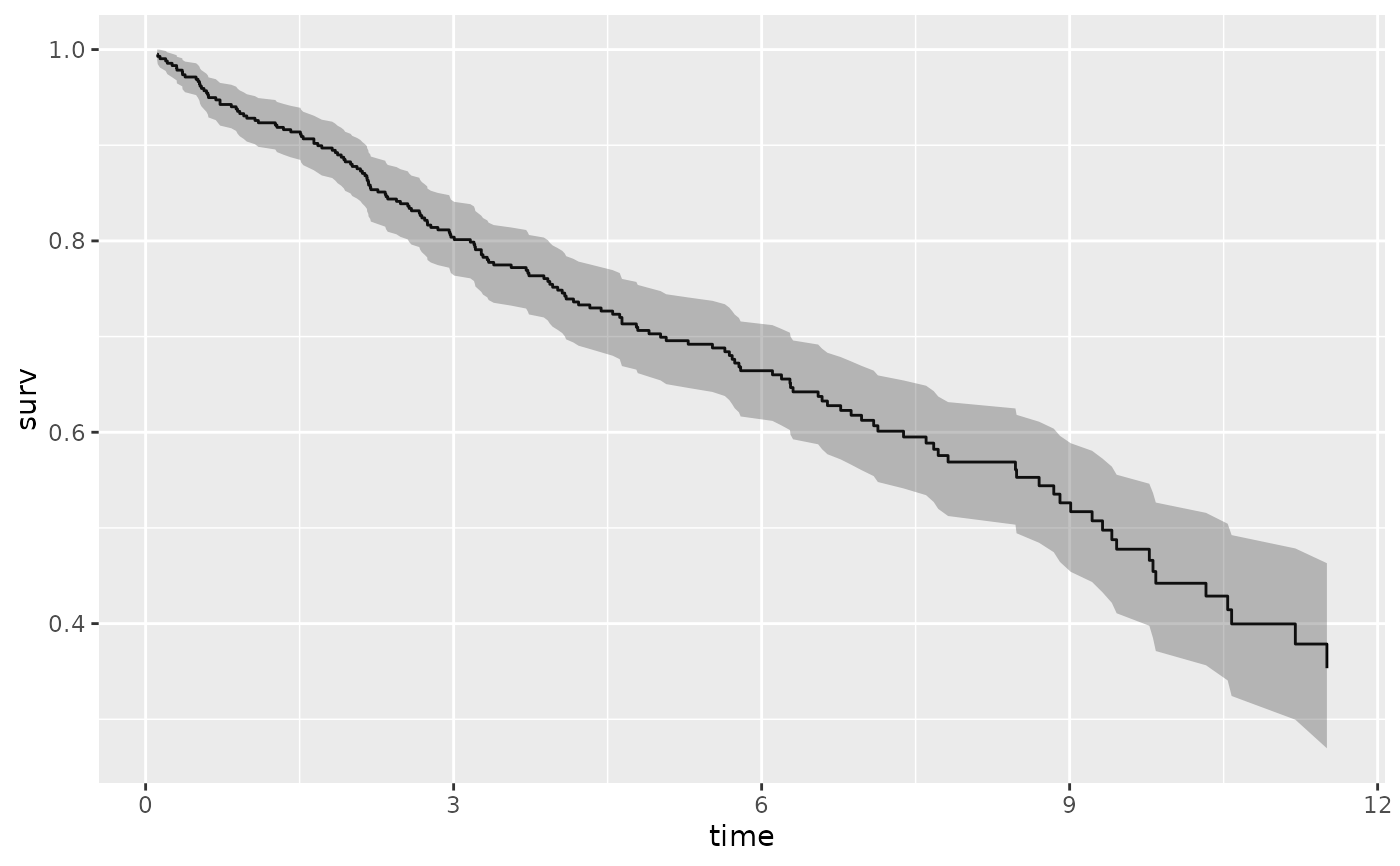
 plot(gg_dta)
 # Stratified on treatment variable.
gg_dta <- gg_survival(
interval = "time", censor = "status",
data = pbc, by = "treatment"
)
plot(gg_dta, error = "none")
# Stratified on treatment variable.
gg_dta <- gg_survival(
interval = "time", censor = "status",
data = pbc, by = "treatment"
)
plot(gg_dta, error = "none")
 plot(gg_dta)
 plot(gg_dta, label = "treatment")
 # ...with smaller confidence limits.
gg_dta <- gg_survival(
interval = "time", censor = "status",
data = pbc, by = "treatment", conf.int = .68
)
plot(gg_dta, error = "lines")
# ...with smaller confidence limits.
gg_dta <- gg_survival(
interval = "time", censor = "status",
data = pbc, by = "treatment", conf.int = .68
)
plot(gg_dta, error = "lines")
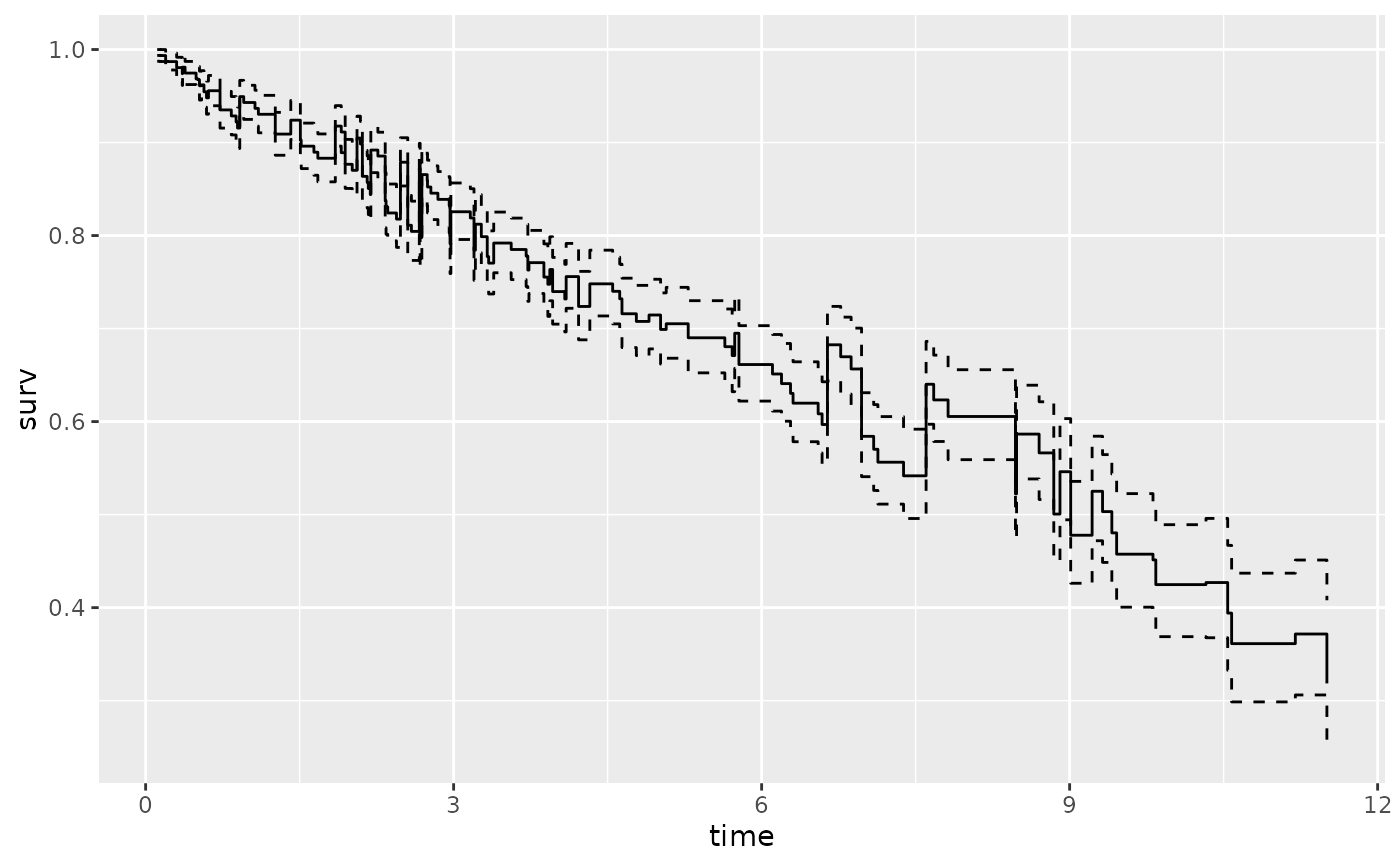 plot(gg_dta, label = "treatment", error = "lines")
#> Ignoring unknown labels:
#> • fill : "treatment"
plot(gg_dta, label = "treatment", error = "lines")
#> Ignoring unknown labels:
#> • fill : "treatment"
 # ...with smaller confidence limits.
gg_dta <- gg_survival(
interval = "time", censor = "status",
data = pbc, by = "sex", conf.int = .68
)
plot(gg_dta, error = "lines")
# ...with smaller confidence limits.
gg_dta <- gg_survival(
interval = "time", censor = "status",
data = pbc, by = "sex", conf.int = .68
)
plot(gg_dta, error = "lines")
 plot(gg_dta, label = "sex", error = "lines")
#> Ignoring unknown labels:
#> • fill : "sex"
plot(gg_dta, label = "sex", error = "lines")
#> Ignoring unknown labels:
#> • fill : "sex"