Validates a wide alluvial-format data frame and returns an
hv_alluvial object. Call plot.hv_alluvial on the
result to obtain a bare ggplot2 alluvial diagram that you can
decorate with colour scales, axis labels, and theme_hv_manuscript.
Arguments
- data
A data frame in wide alluvial format: one row per axis-value combination, a numeric weight column, and one column per axis.
- axes
Character vector of column names to use as axes, in left-to-right display order. Minimum two columns.
- y_col
Name of the numeric weight column (counts or proportions). Default
"freq".- fill_col
Name of the column to map to the flow fill and colour aesthetics, or
NULLfor a single fill. DefaultNULL.- axis_labels
Character vector of axis labels for the x-axis, the same length as
axes. Defaults toaxes(column names).
Value
An object of class c("hv_alluvial", "hv_data"):
$dataThe validated input data frame.
$metaNamed list:
axes,y_col,fill_col,axis_labels,n_axes,n_obs.$tablesEmpty list.
Examples
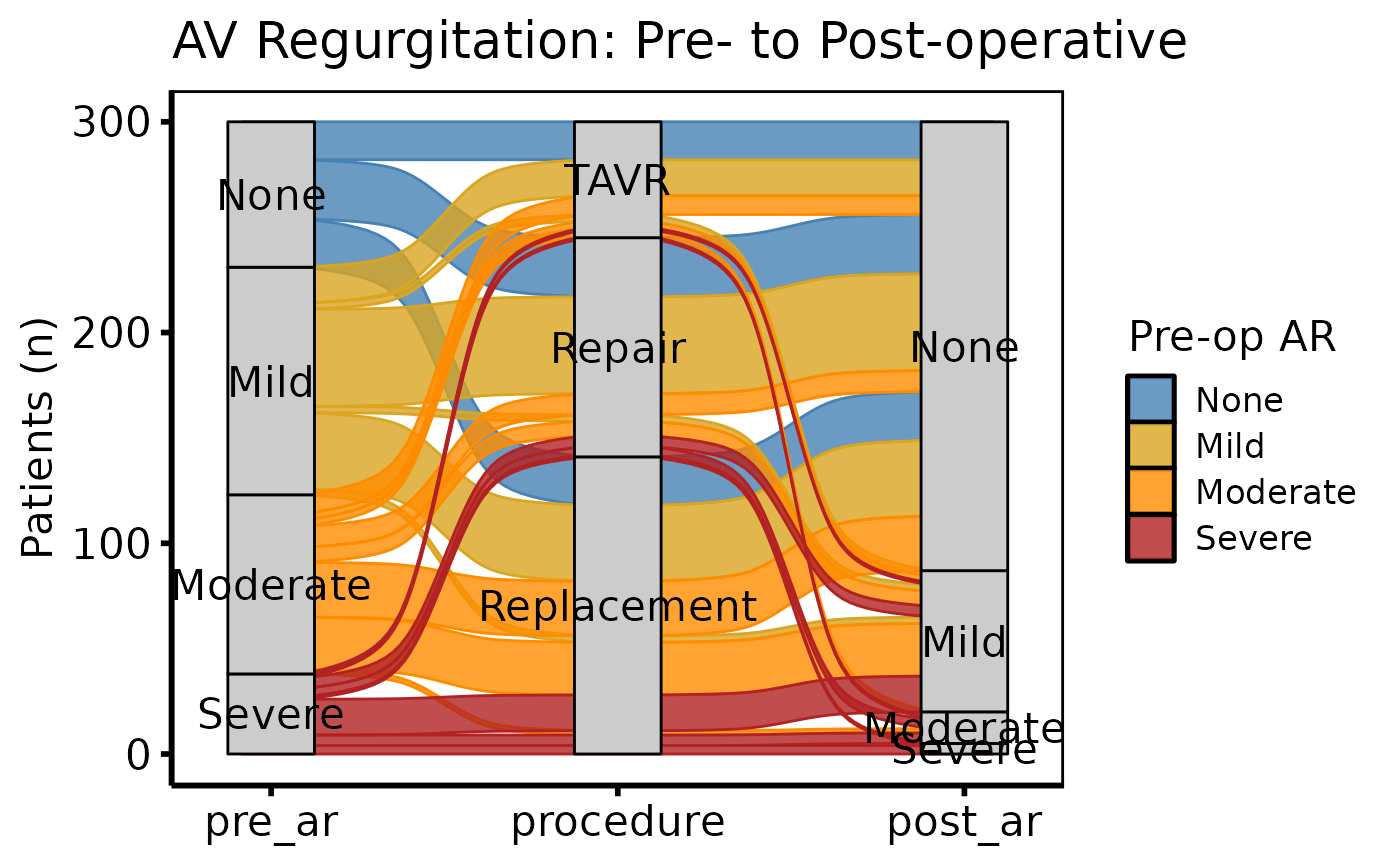
dta  <- sample_alluvial_data(n = 300, seed = 42)
axes <- c("pre_ar", "procedure", "post_ar")

# 1. Build data object
al <- hv_alluvial(dta, axes = axes, y_col = "freq", fill_col = "pre_ar")
al  # prints axes and observation count
#> <hv_alluvial>
#>   Axes (3)    : pre_ar → procedure → post_ar
#>   Weight col  : freq
#>   Fill col    : pre_ar
#>   N rows      : 25

# 2. Bare plot -- undecorated ggplot returned by plot.hv_alluvial
p <- plot(al)

# 3. Decorate: fill/colour palettes, axis labels, theme
p +
  ggplot2::scale_fill_manual(
    values = c(None     = "steelblue",
               Mild     = "goldenrod",
               Moderate = "darkorange",
               Severe   = "firebrick"),
    name = "Pre-op AR"
  ) +
  ggplot2::scale_colour_manual(
    values = c(None     = "steelblue",
               Mild     = "goldenrod",
               Moderate = "darkorange",
               Severe   = "firebrick"),
    guide = "none"
  ) +
  ggplot2::labs(y = "Patients (n)",
                title = "AV Regurgitation: Pre- to Post-operative") +
  theme_hv_poster()
#> Warning: Some strata appear at multiple axes.
#> Warning: Some strata appear at multiple axes.
#> Warning: Some strata appear at multiple axes.