Stores pre-computed NNT (or ARR) data as an hv_nnt object. Rows where
estimate_col is NA (undefined when ARR is near zero) are optionally
removed during construction via na_rm. Pass the result to
plot.hv_nnt() to render the plot. Covers the NNT component of
tp.hp.numtreat.survdiff.matched.sas.
Usage
hv_nnt(
  nnt_data,
  x_col = "time",
  estimate_col = "nnt",
  lower_col = NULL,
  upper_col = NULL,
  group_col = NULL,
  na_rm = TRUE
)
Arguments
- nnt_data
Data frame of pre-computed NNT estimates. See
sample_nnt_data().- x_col
Name of the time column. Default
"time".- estimate_col
Name of the NNT (or ARR) column. Default
"nnt".- lower_col
Lower CI column, or
NULL. DefaultNULL.- upper_col
Upper CI column, or
NULL. DefaultNULL.- group_col
Grouping column for multiple comparisons, or
NULL. DefaultNULL.- na_rm
Remove rows where
estimate_colisNAbefore storing in$data. Applied at construction time. DefaultTRUE.
Examples
library(ggplot2)
nnt_dat <- sample_nnt_data(
n = 500, time_max = 20,
groups = c("SVG" = 1.0, "ITA" = 0.75)
)
# 1. Build data object
nn <- hv_nnt(nnt_dat, lower_col = "nnt_lower", upper_col = "nnt_upper")
nn # prints estimate column and CI flags
#> <hv_nnt>
#> x col : time
#> estimate : nnt
#> CI : nnt_lower -- nnt_upper
#> na_rm : TRUE
#> $data : 496 rows × 7 cols
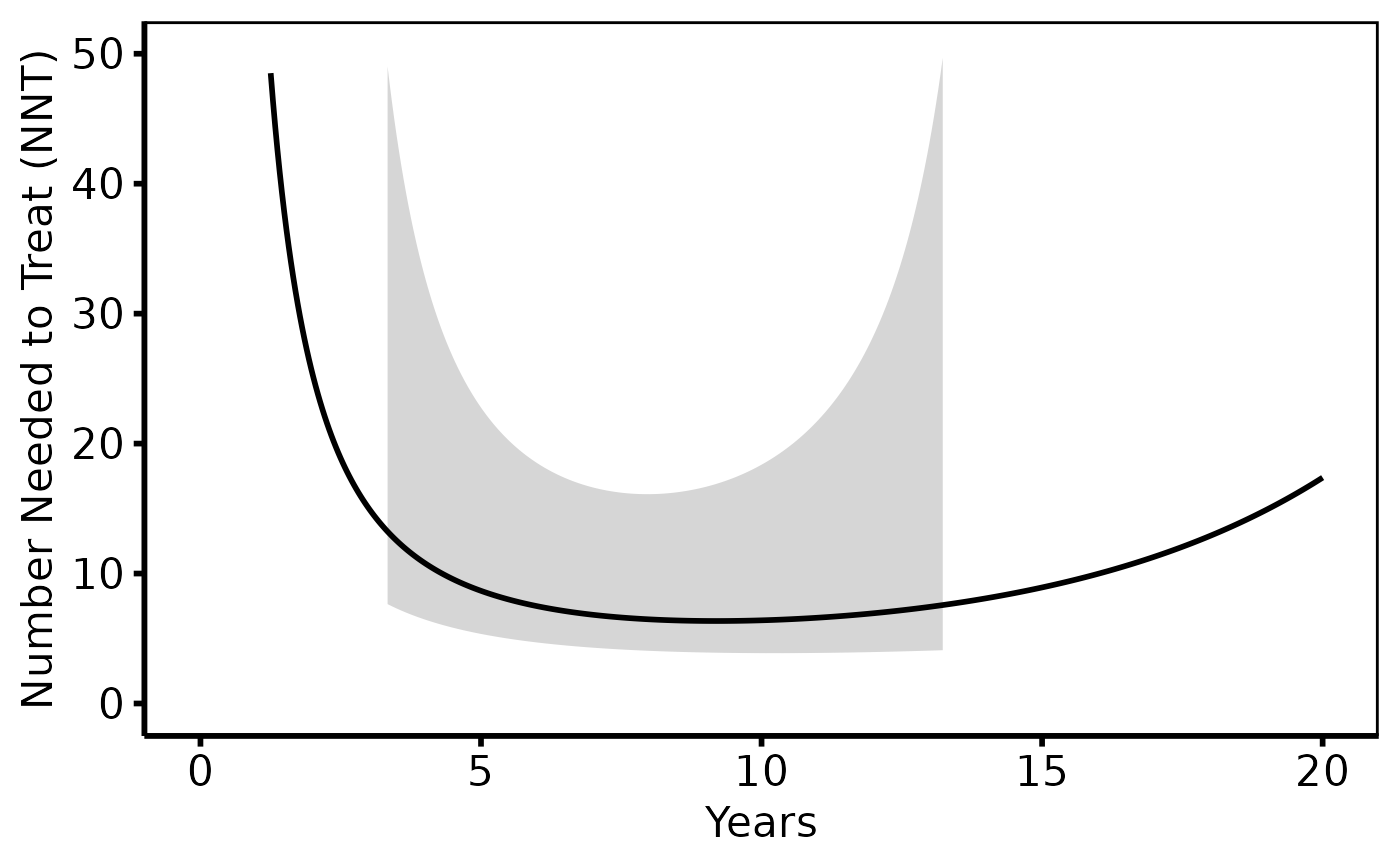
# 2. Bare plot -- undecorated ggplot returned by plot.hv_nnt
p <- plot(nn)
# 3. Decorate: axis scales, labels, theme
p +
scale_x_continuous(limits = c(0, 20), breaks = seq(0, 20, 5)) +
scale_y_continuous(limits = c(0, 50), breaks = seq(0, 50, 10)) +
labs(x = "Years", y = "Number Needed to Treat (NNT)") +
theme_hv_poster()
#> Warning: Removed 248 rows containing missing values or values outside the scale range
#> (`geom_ribbon()`).
#> Warning: Removed 27 rows containing missing values or values outside the scale range
#> (`geom_line()`).
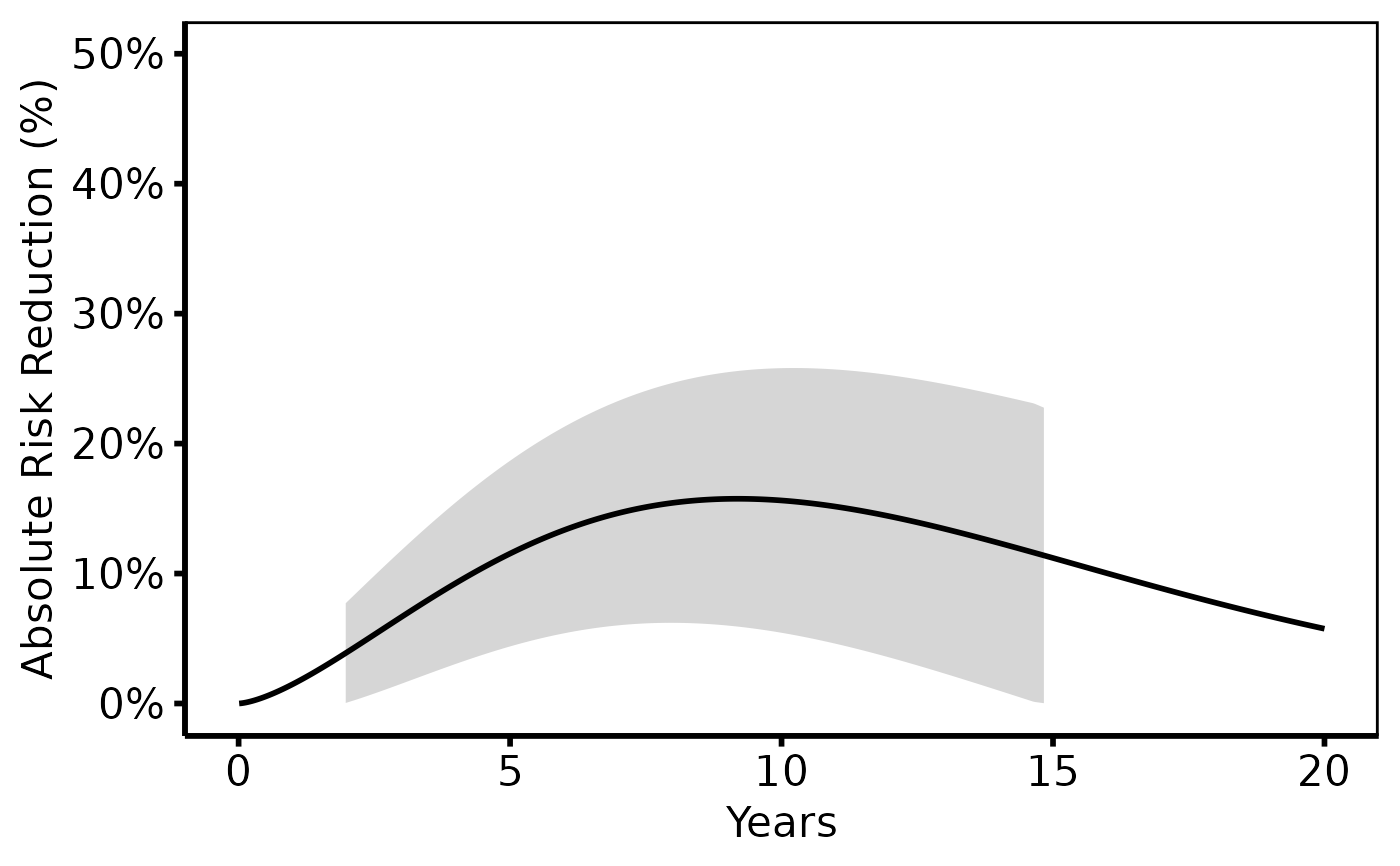
 # ARR curve -- same 3-step pattern with a different estimate column
ar <- hv_nnt(nnt_dat, estimate_col = "arr",
lower_col = "arr_lower", upper_col = "arr_upper",
na_rm = FALSE)
plot(ar) +
scale_y_continuous(limits = c(0, 50),
labels = function(x) paste0(x, "%")) +
labs(x = "Years", y = "Absolute Risk Reduction (%)") +
theme_hv_poster()
#> Warning: Removed 178 rows containing missing values or values outside the scale range
#> (`geom_ribbon()`).
# ARR curve -- same 3-step pattern with a different estimate column
ar <- hv_nnt(nnt_dat, estimate_col = "arr",
lower_col = "arr_lower", upper_col = "arr_upper",
na_rm = FALSE)
plot(ar) +
scale_y_continuous(limits = c(0, 50),
labels = function(x) paste0(x, "%")) +
labs(x = "Years", y = "Absolute Risk Reduction (%)") +
theme_hv_poster()
#> Warning: Removed 178 rows containing missing values or values outside the scale range
#> (`geom_ribbon()`).