Validates a long-format repeated-measures data frame and returns an
hv_spaghetti object. Call plot.hv_spaghetti on
the result to obtain a bare ggplot2 trajectory plot that you can
decorate with colour scales, axis labels, and theme_hv_manuscript.
Arguments
- data
Data frame; one row per observation per subject.
- x_col
Name of the time column. Default
"time".- y_col
Name of the outcome column. Default
"value".- id_col
Name of the subject-identifier column (used as the
groupaesthetic for line continuity). Default"id".- colour_col
Name of the column to map to line colour, or
NULLfor a single uniform colour. DefaultNULL.
Value
An object of class c("hv_spaghetti", "hv_data"); call
plot() on the result to render the figure — see
plot.hv_spaghetti. The list contains:
$dataThe validated input data frame.
$metaNamed list:
x_col,y_col,id_col,colour_col,n_subjects,n_obs.$tablesEmpty list.
See also
plot.hv_spaghetti to render as a ggplot2 figure,
theme_hv_manuscript for the publication theme,
sample_spaghetti_data for example data.
Other Spaghetti plot:
plot.hv_spaghetti()
Examples
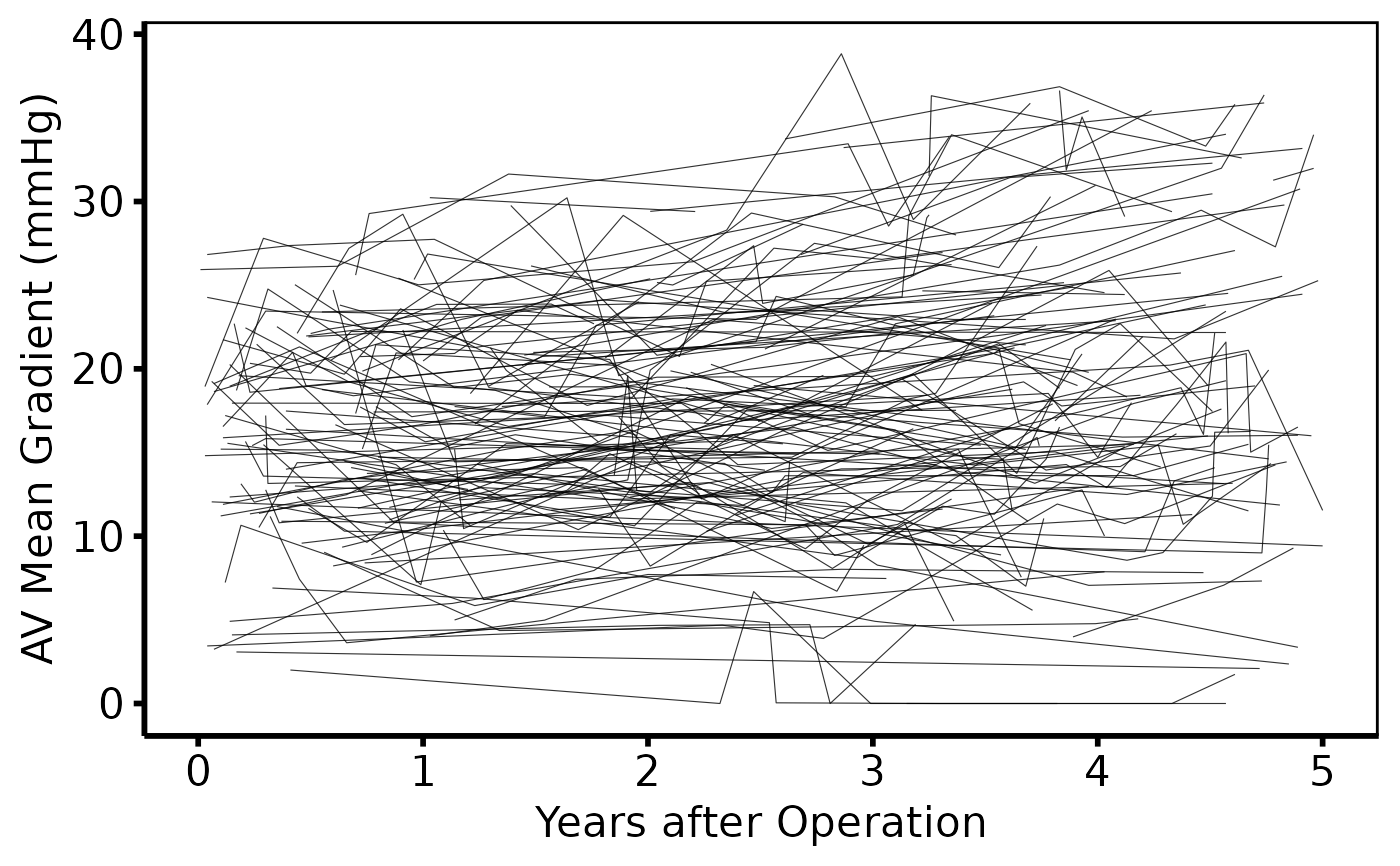
dta <- sample_spaghetti_data(n_patients = 150, seed = 42)

# 1. Build data object
sp <- hv_spaghetti(dta, colour_col = "group")
sp  # prints subject count, observation count, column mapping
#> <hv_spaghetti>
#>   N subjects  : 150  (594 observations)
#>   x / y / id  : time / value / id
#>   Colour col  : group

# 2. Bare plot -- undecorated ggplot returned by plot.hv_spaghetti
p <- plot(sp)

# 3. Decorate: colour palette, axis labels, theme
p +
  ggplot2::scale_colour_manual(
    values = c(Female = "firebrick", Male = "steelblue"), name = NULL
  ) +
  ggplot2::labs(x = "Years after Operation",
                y = "AV Mean Gradient (mmHg)") +
  theme_hv_poster()
#> Warning: No shared levels found between `names(values)` of the manual scale and the
#> data's colour values.
#> Warning: Ignoring empty aesthetic: `colour`.