Draws one trajectory line per subject over time, optionally stratified by colour and with a LOESS (or other) smooth overlay.
Usage
# S3 method for class 'hv_spaghetti'
plot(
  x,
  line_colour = "grey50",
  line_width = 0.2,
  alpha = 0.8,
  add_smooth = FALSE,
  smooth_method = "loess",
  smooth_se = FALSE,
  smooth_width = 1.2,
  y_labels = NULL,
  ...
)
Arguments
- x
An
hv_spaghettiobject.- line_colour
Fixed line colour used when
colour_col = NULL. Default"grey50".- line_width
Line width for individual trajectories. Default
0.2.- alpha
Transparency of plot elements in \([0,1]\). Default
0.8.- add_smooth
Logical; overlay a smoother? Default
FALSE.- smooth_method
Smoothing method passed to
geom_smooth(). Default"loess".- smooth_se
Logical; show CI ribbon around smooth? Default
FALSE.- smooth_width
Line width for the smooth overlay. Default
1.2.- y_labels
Named numeric vector for an ordinal y-axis, e.g.
c(None = 0, Mild = 1, Moderate = 2, Severe = 3). DefaultNULL(standard numeric axis).- ...
Ignored; present for S3 consistency.
Value
A bare ggplot object; compose with +
to add scales, axis limits, labels, and theme_hv_manuscript.
See also
hv_spaghetti to build the data object,
theme_hv_manuscript for the publication theme.
Other Spaghetti plot:
hv_spaghetti()
Examples
dta <- sample_spaghetti_data(n_patients = 150, seed = 42)
sp <- hv_spaghetti(dta, colour_col = "group")
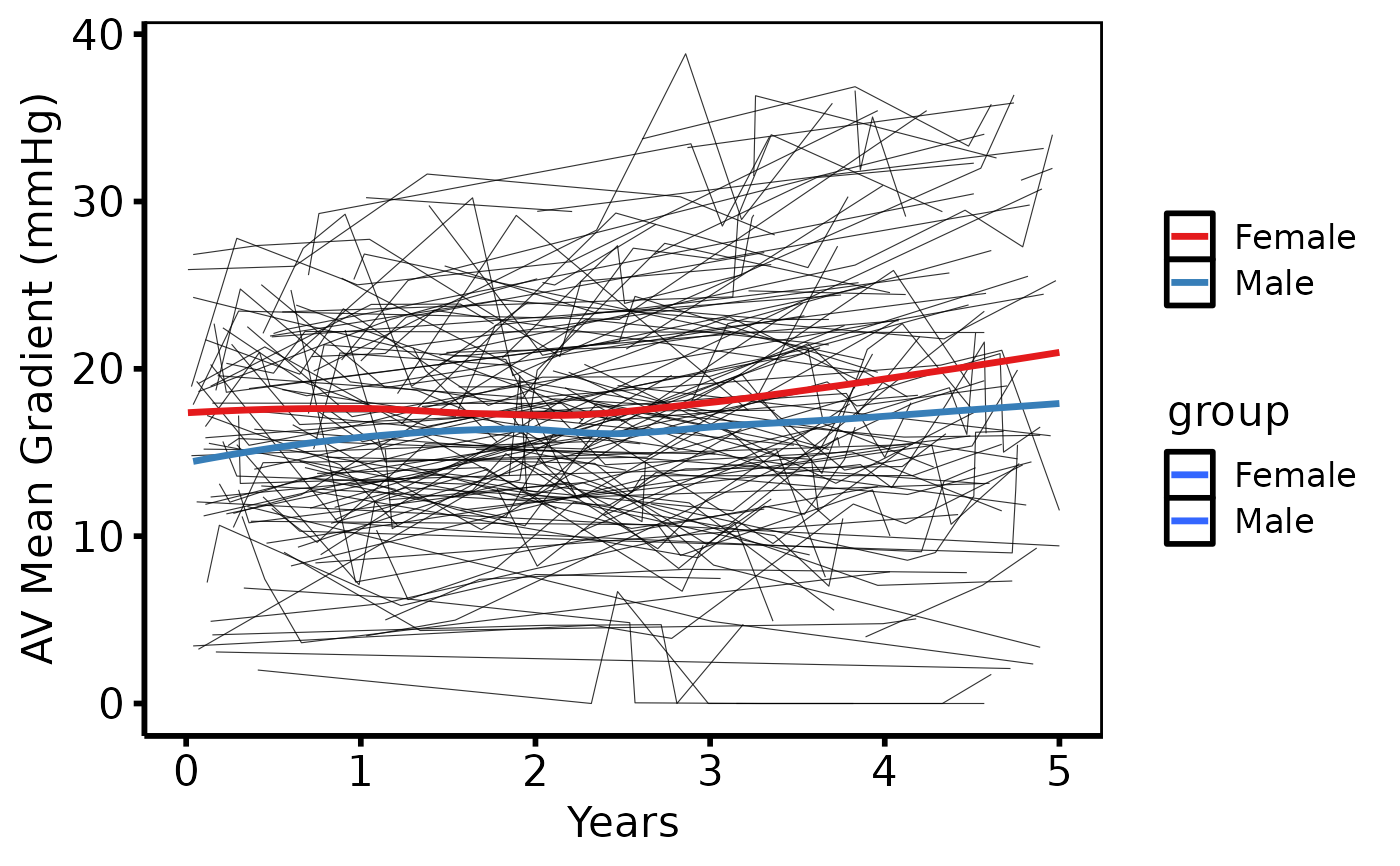
# With LOESS smooth overlay
plot(sp, add_smooth = TRUE) +
ggplot2::scale_colour_brewer(palette = "Set1", name = NULL) +
ggplot2::labs(x = "Years", y = "AV Mean Gradient (mmHg)") +
theme_hv_poster()
#> Warning: Ignoring empty aesthetic: `colour`.
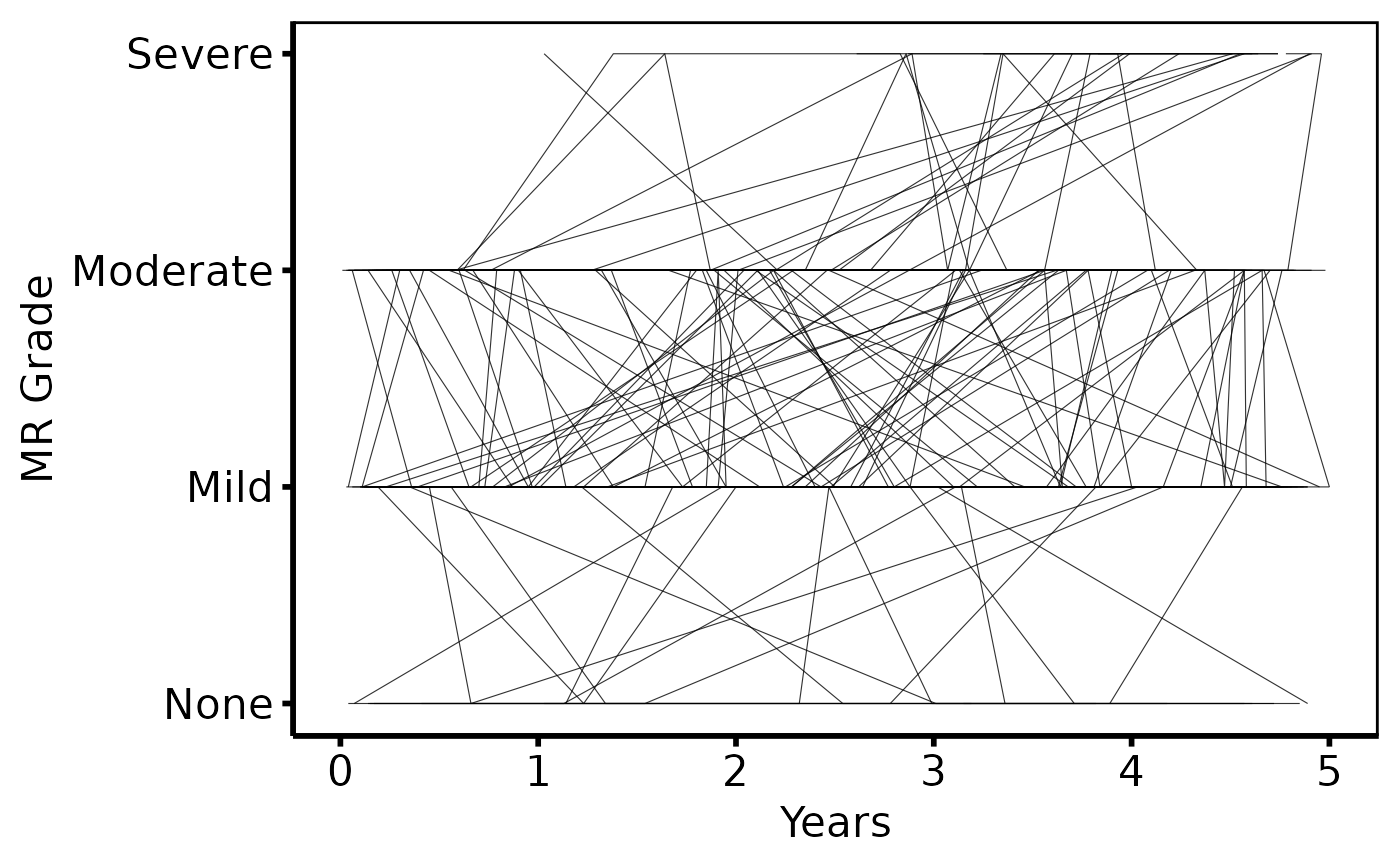
 # Ordinal y-axis
dta_ord <- dta
dta_ord$value <- round(pmin(3, pmax(0, dta$value / 12)))
plot(hv_spaghetti(dta_ord, colour_col = "group"),
y_labels = c(None = 0, Mild = 1, Moderate = 2, Severe = 3)) +
ggplot2::labs(x = "Years", y = "MR Grade") +
theme_hv_poster()
#> Warning: Ignoring empty aesthetic: `colour`.
# Ordinal y-axis
dta_ord <- dta
dta_ord$value <- round(pmin(3, pmax(0, dta$value / 12)))
plot(hv_spaghetti(dta_ord, colour_col = "group"),
y_labels = c(None = 0, Mild = 1, Moderate = 2, Severe = 3)) +
ggplot2::labs(x = "Years", y = "MR Grade") +
theme_hv_poster()
#> Warning: Ignoring empty aesthetic: `colour`.
 # --- Global theme (set once per session) ----------------------------------
if (FALSE) { # \dontrun{
old <- ggplot2::theme_set(theme_hv_manuscript())
plot(sp, add_smooth = TRUE) +
ggplot2::scale_colour_brewer(palette = "Set1", name = NULL) +
ggplot2::labs(x = "Years", y = "AV Mean Gradient (mmHg)")
ggplot2::theme_set(old)
} # }
# See vignette("plot-decorators", package = "hvtiPlotR") for theming,
# colour scales, annotation labels, and saving plots.
# --- Global theme (set once per session) ----------------------------------
if (FALSE) { # \dontrun{
old <- ggplot2::theme_set(theme_hv_manuscript())
plot(sp, add_smooth = TRUE) +
ggplot2::scale_colour_brewer(palette = "Set1", name = NULL) +
ggplot2::labs(x = "Years", y = "AV Mean Gradient (mmHg)")
ggplot2::theme_set(old)
} # }
# See vignette("plot-decorators", package = "hvtiPlotR") for theming,
# colour scales, annotation labels, and saving plots.