Validates a set-membership data frame, checks all intersect columns are
binary (logical or 0/1 integer), computes per-set counts, and returns an
hv_upset object. Call plot.hv_upset on the result to
obtain a ggplot2 UpSet diagram (backed by
scale_x_upset).
Value
An object of class c("hv_upset", "hv_data"):
$dataThe validated input data frame, plus a
.Procedureslist-column derived from the indicator matrix (consumed byscale_x_upset()).$metaNamed list:
intersect,n_patients,n_sets.$tablesList with one element:
set_counts– a named integer vector of per-set patient counts.
Examples
sets <- c("AV_Replacement", "AV_Repair", "MV_Replacement", "MV_Repair",
"TV_Repair", "Aorta", "CABG")
dta <- sample_upset_data(n = 300, seed = 42)
# 1. Build data object
up <- hv_upset(dta, intersect = sets)
up # prints set counts
#> <hv_upset>
#> N patients : 300 (7 sets)
#> Set counts :
#> AV_Replacement 93
#> AV_Repair 40
#> MV_Replacement 45
#> MV_Repair 33
#> TV_Repair 36
#> Aorta 37
#> CABG 114
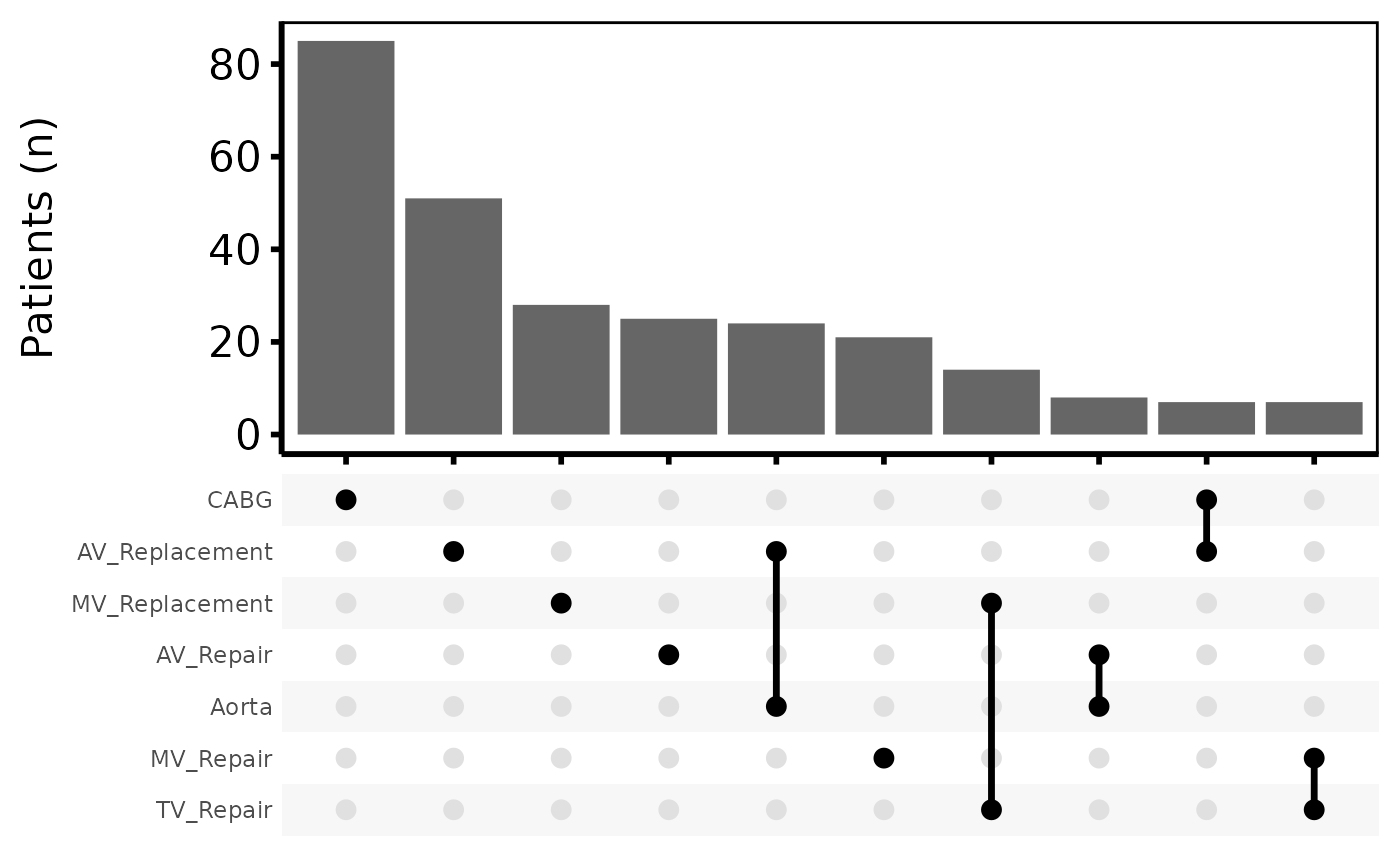
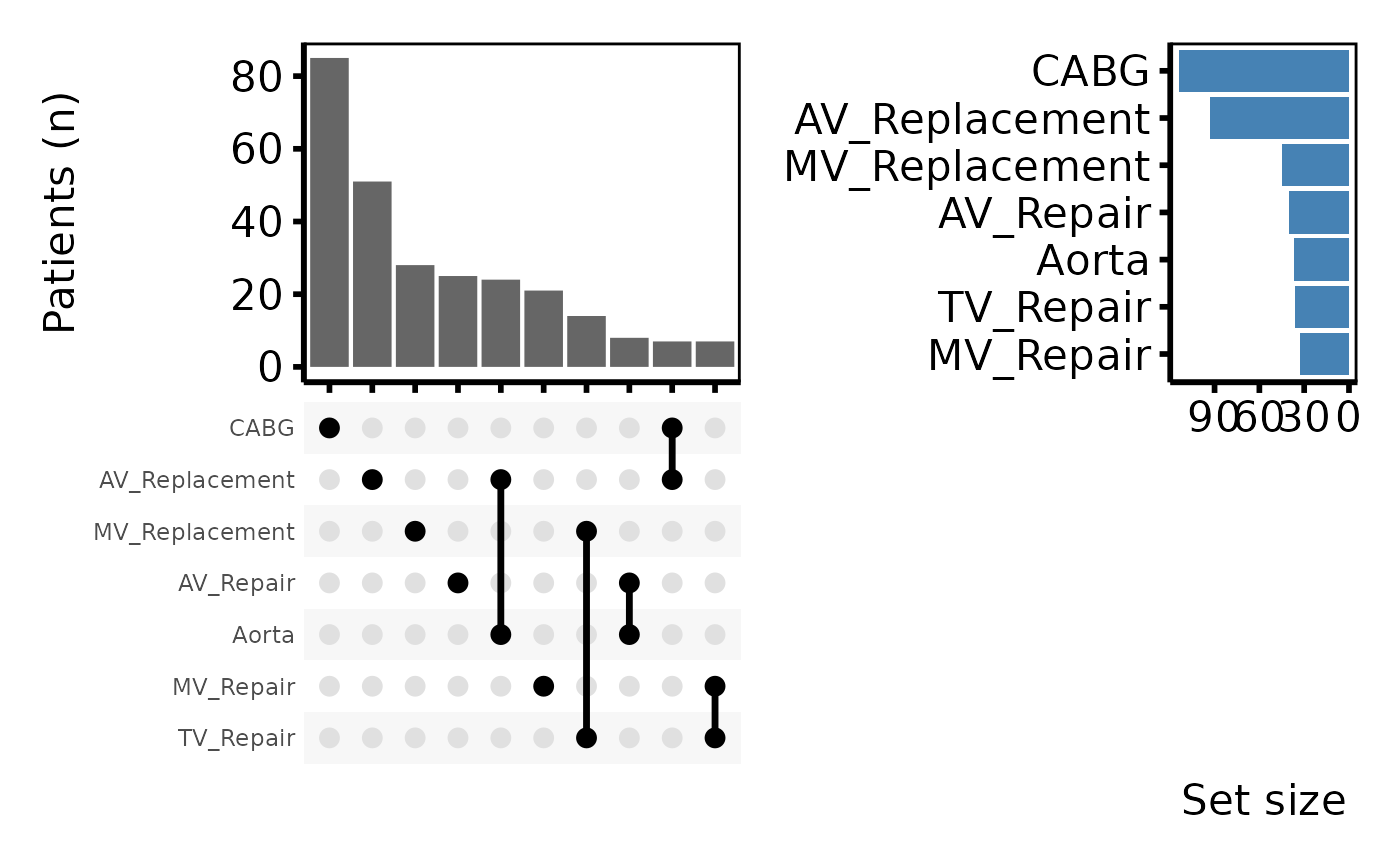
# 2. Plot. The default (set_size = TRUE) returns a patchwork composite,
# so apply themes with `&` to theme every sub-panel. Use `+` for
# set_size = FALSE (a plain ggplot).
plot(up) & theme_hv_poster()
#> Warning: Removed 30 rows containing non-finite outside the scale range (`stat_count()`).
#> Warning: Using `size` aesthetic for lines was deprecated in ggplot2 3.4.0.
#> ℹ Please use `linewidth` instead.
#> ℹ The deprecated feature was likely used in the ggupset package.
#> Please report the issue at <https://github.com/const-ae/ggupset/issues>.
 plot(up, set_size = FALSE) + theme_hv_poster()
#> Warning: Removed 30 rows containing non-finite outside the scale range (`stat_count()`).
plot(up, set_size = FALSE) + theme_hv_poster()
#> Warning: Removed 30 rows containing non-finite outside the scale range (`stat_count()`).