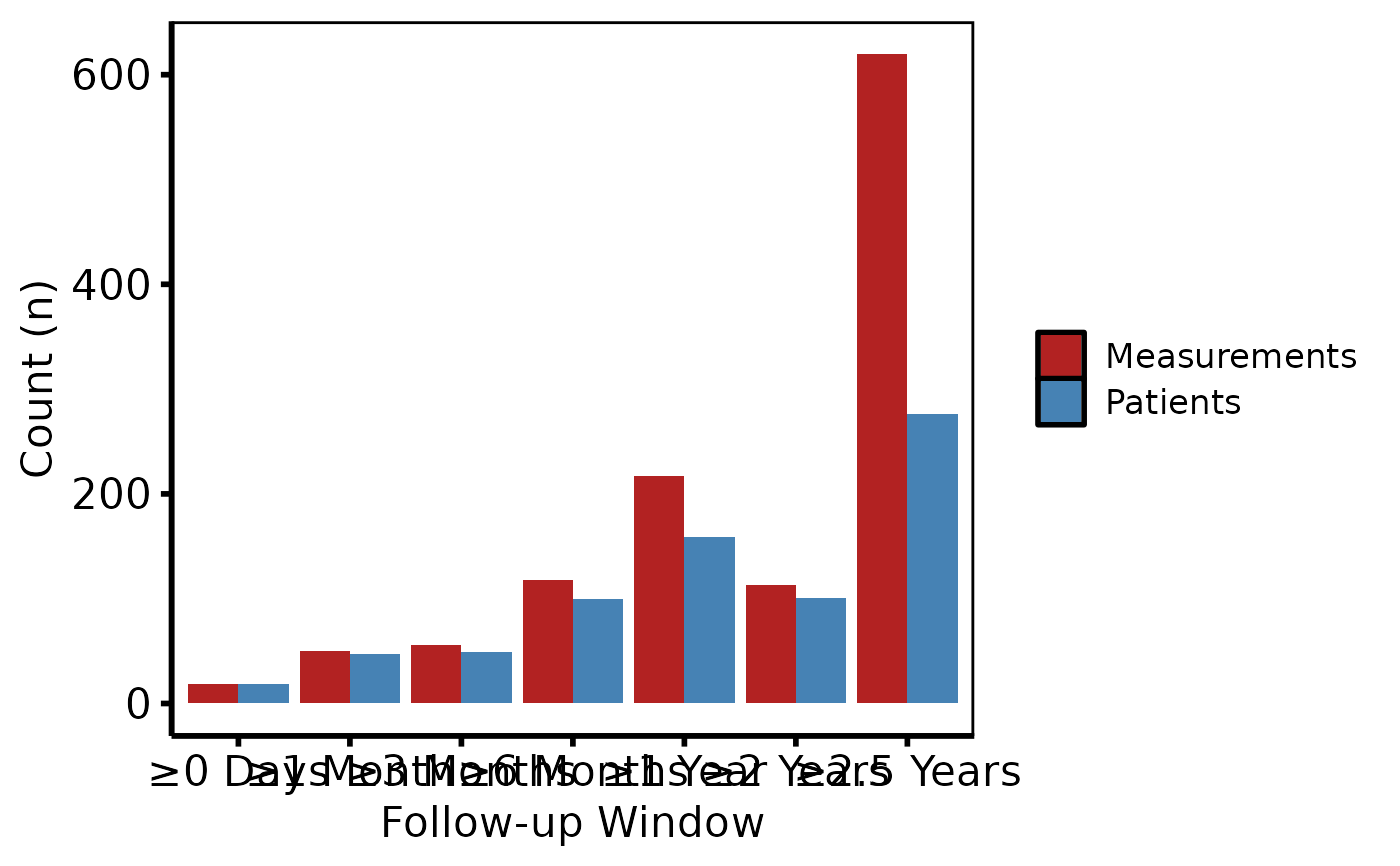
Draws either a grouped bar chart of counts by time point (type = "plot")
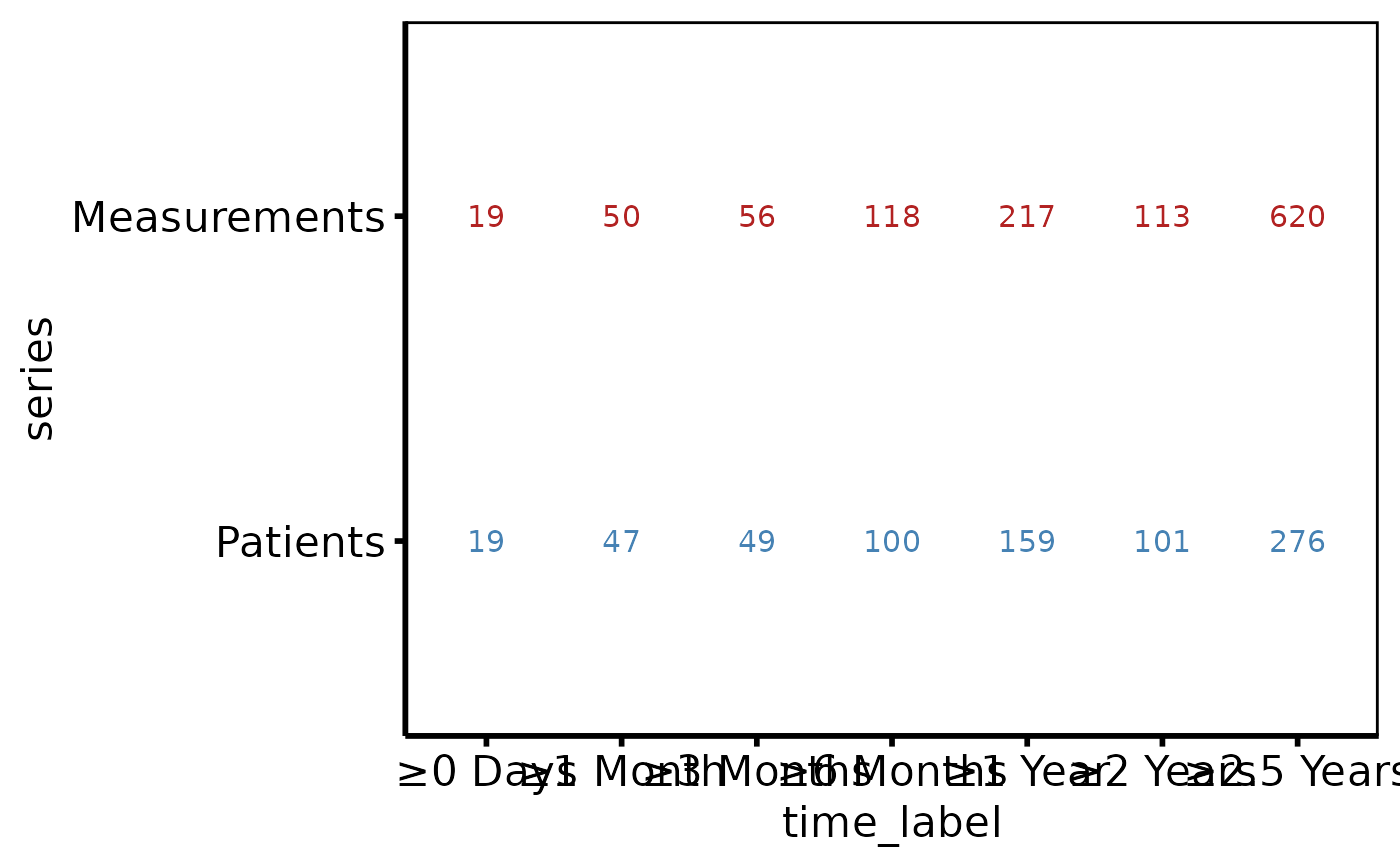
or a numeric text-table panel suitable for composing below the bar chart via
patchwork (type = "table").
Arguments
- x
An
hv_longitudinalobject.- type
Which panel to produce:
"plot"(default) or"table".- position
Bar position for
type = "plot":"dodge"(default) or"stack".- label_format
Formatting function applied to count values for
type = "table".NULL(default) auto-selectsscales::commawhen the scales package is installed, otherwise falls back tobase::as.character. Passidentityto display counts without formatting.- ...
Ignored; present for S3 consistency.
Value
A bare ggplot object.
Examples
library(ggplot2)
dta <- sample_longitudinal_counts_data(n_patients = 300, seed = 42L)
lc <- hv_longitudinal(dta)
# Bar chart
plot(lc, type = "plot") +
scale_fill_manual(
values = c(Patients = "steelblue", Measurements = "firebrick"),
name = NULL
) +
labs(x = "Follow-up Window", y = "Count (n)") +
theme_hv_poster()
 # Text table panel
plot(lc, type = "table") +
scale_colour_manual(
values = c(Patients = "steelblue", Measurements = "firebrick"),
guide = "none"
) +
theme_hv_poster()
# Text table panel
plot(lc, type = "table") +
scale_colour_manual(
values = c(Patients = "steelblue", Measurements = "firebrick"),
guide = "none"
) +
theme_hv_poster()
 # Compose with patchwork
# p_bar <- plot(lc, type = "plot") + <decorators>
# p_table <- plot(lc, type = "table") + <decorators>
# p_bar / p_table + patchwork::plot_layout(heights = c(3, 1))
# Compose with patchwork
# p_bar <- plot(lc, type = "plot") + <decorators>
# p_table <- plot(lc, type = "table") + <decorators>
# p_bar / p_table + patchwork::plot_layout(heights = c(3, 1))