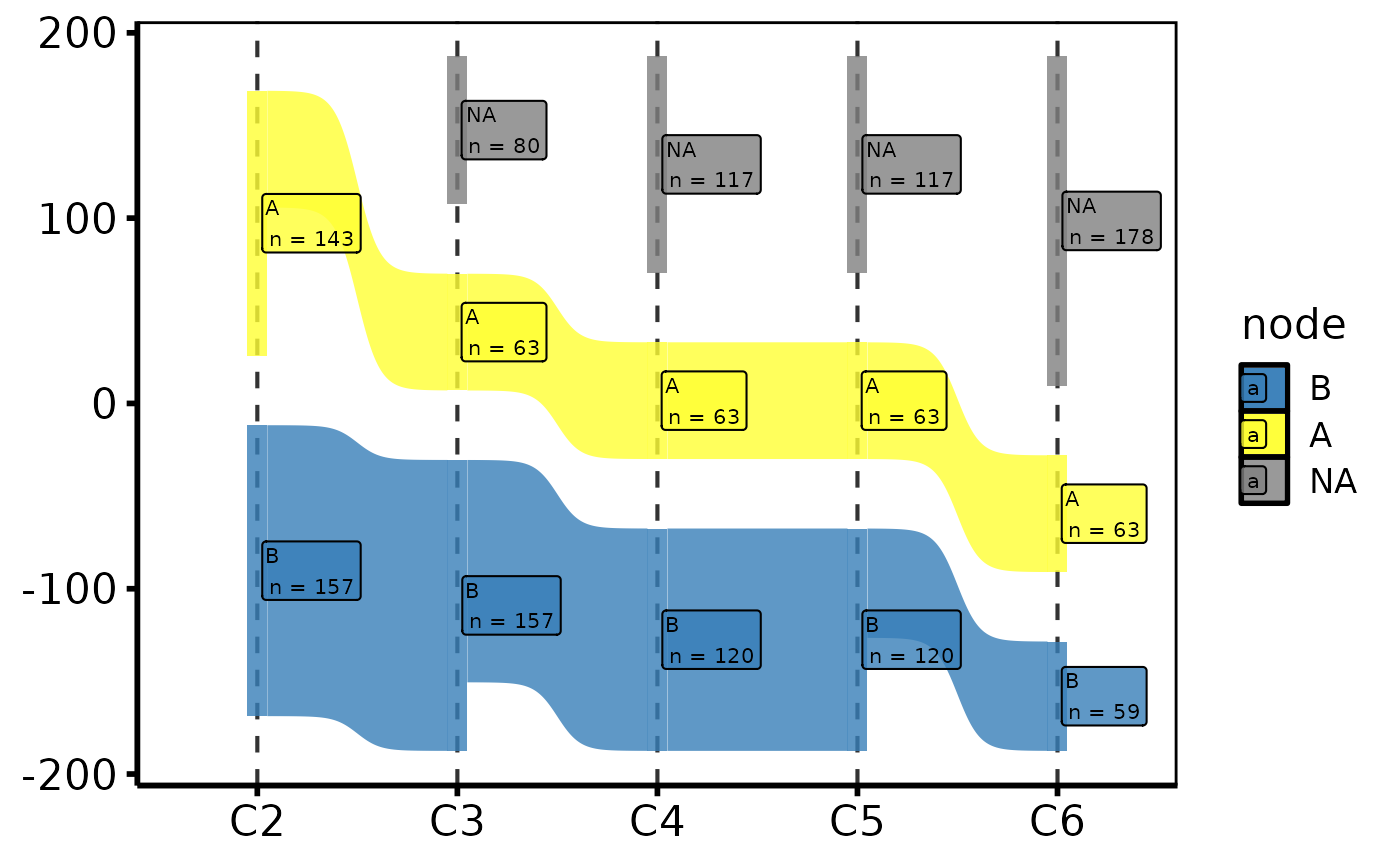
Draws a cluster stability Sankey diagram using ggsankey geoms. Requires the ggsankey package. Install with:
remotes::install_github("davidsjoberg/ggsankey")Usage
# S3 method for class 'hv_sankey'
plot(x, alpha = 0.8, label_size = 8, label_hjust = -0.05, ...)Value
A ggplot object using ggsankey geoms.
Compose with scale_fill_manual(), labs(), theme(),
and theme_hv_manuscript.
Examples
dta <- sample_cluster_sankey_data(n = 300, seed = 42)

if (requireNamespace("ggsankey", quietly = TRUE)) {
  plot(hv_sankey(dta)) +
    ggplot2::labs(x = NULL, title = "Cluster Stability: K = 2 to 9") +
    theme_hv_poster()

  # Subset to K = 2 to 6
  plot(hv_sankey(dta, cluster_cols = paste0("C", 2:6))) +
    ggplot2::labs(x = NULL) +
    theme_hv_poster()
}