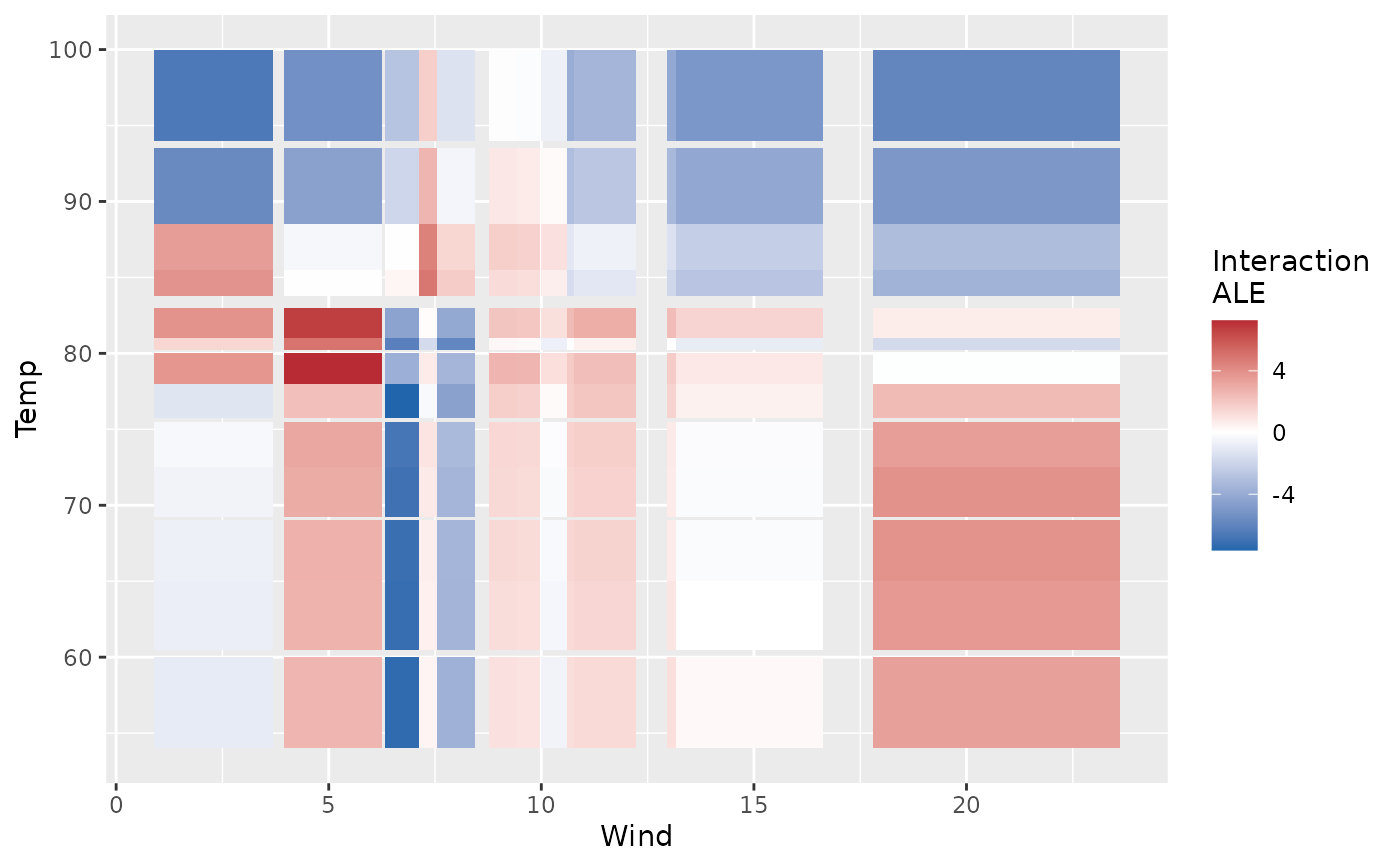
Renders the second-order (interaction) ALE surface from
gg_ale_rfsrc (when called with xvar2.name) as a
ggplot2 heatmap. Values near zero mean the two predictors act
additively over that region of their joint range; large positive or
negative values mark where their combined effect departs from the sum
of their individual main effects.
Usage
# S3 method for class 'gg_ale_interaction'
plot(x, ...)Examples
# \donttest{
airq.obj <- randomForestSRC::rfsrc(Ozone ~ ., data = na.omit(airquality),
ntree = 50)
ale_int <- gg_ale_rfsrc(airq.obj, xvar.names = "Wind",
xvar2.name = "Temp", n_eval = 12)
plot(ale_int)
 # }
# }