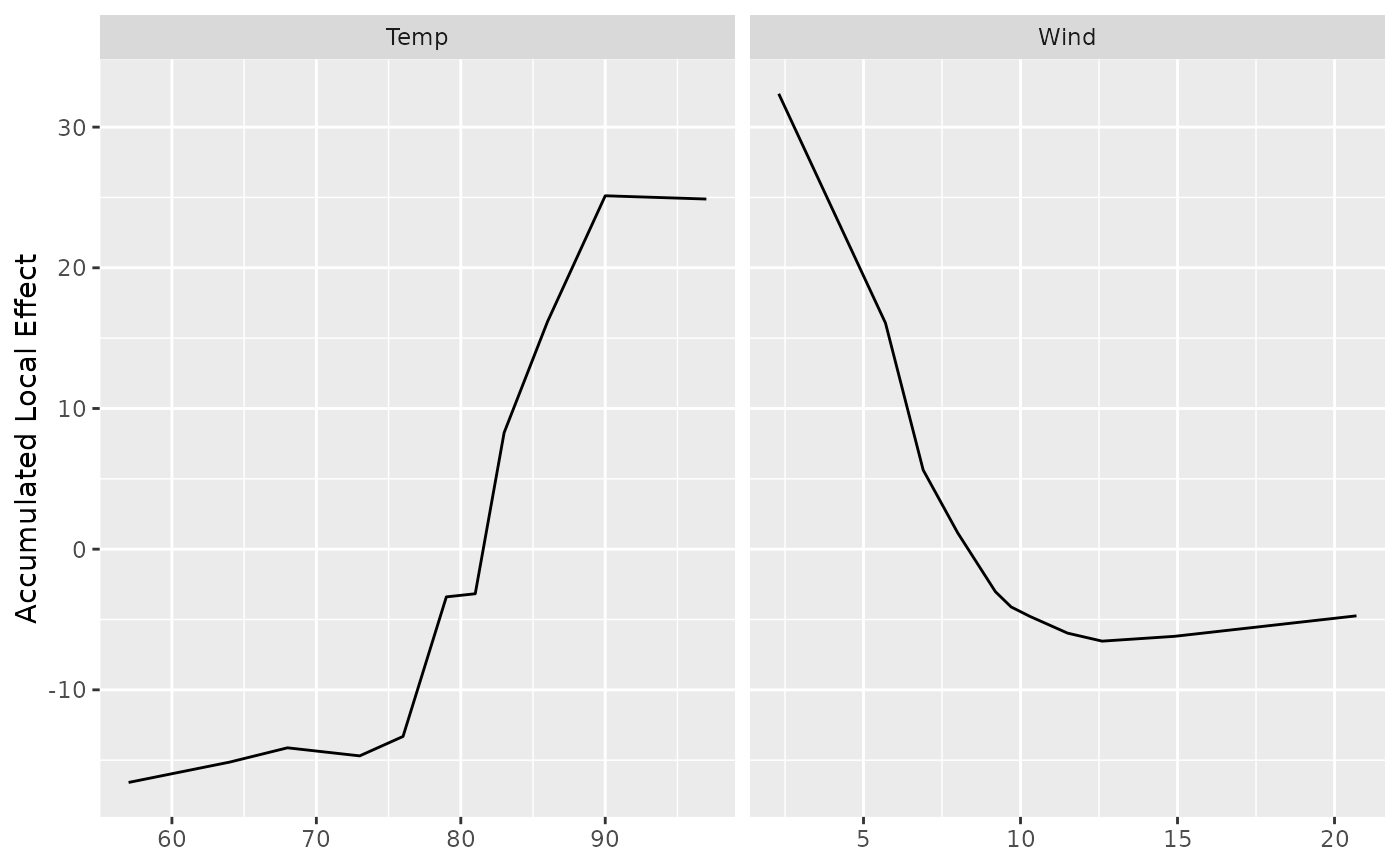
Renders first-order Accumulated Local Effects as a ggplot2 figure.
Continuous predictors are drawn as line plots and categorical predictors
as bar charts, both faceted by variable name, the same arrangement as
plot.gg_partial_rfsrc, so the two are directly comparable
side by side.
Usage
# S3 method for class 'gg_ale_rfsrc'
plot(x, labels = NULL, ...)
Arguments
- x
A
gg_ale_rfsrcobject.- labels
Optional variable labels for the facet strips. One of: a named character vector (
c(bpd_last = "BP Diastole")); a labelled data frame, whoseattr(col, "label")values are read; or a two-columnkey/labeldata frame. Variables with no label keep their raw name. Defaults toNULL(raw names).- ...
Not currently used.
Value
A ggplot (or patchwork) object. When both
continuous and categorical variables are present the two panels are
combined vertically via patchwork::wrap_plots().
Examples
airq.obj <- randomForestSRC::rfsrc(Ozone ~ ., data = na.omit(airquality),
                                    ntree = 50)
ale_dta <- gg_ale_rfsrc(airq.obj, xvar.names = c("Wind", "Temp"),
                         n_eval = 10)
plot(ale_dta)