Renders the partial dependence curves from gg_partial_rfsrc
as a ggplot2 figure. The layout adapts automatically to what the object
contains.
Usage
# S3 method for class 'gg_partial_rfsrc'
plot(x, labels = NULL, ...)
Arguments
- x
A
gg_partial_rfsrcobject.- labels
Optional variable labels for the facet strips. One of: a named character vector (
c(bpd_last = "BP Diastole")); a labelled data frame, whoseattr(col, "label")values are read; or a two-columnkey/labeldata frame. Variables with no label keep their raw name. Defaults toNULL(raw names).- ...
Not currently used.
Value
A ggplot (or patchwork) object. When both continuous
and categorical variables are present the two panels are combined
vertically via patchwork::wrap_plots().
Details
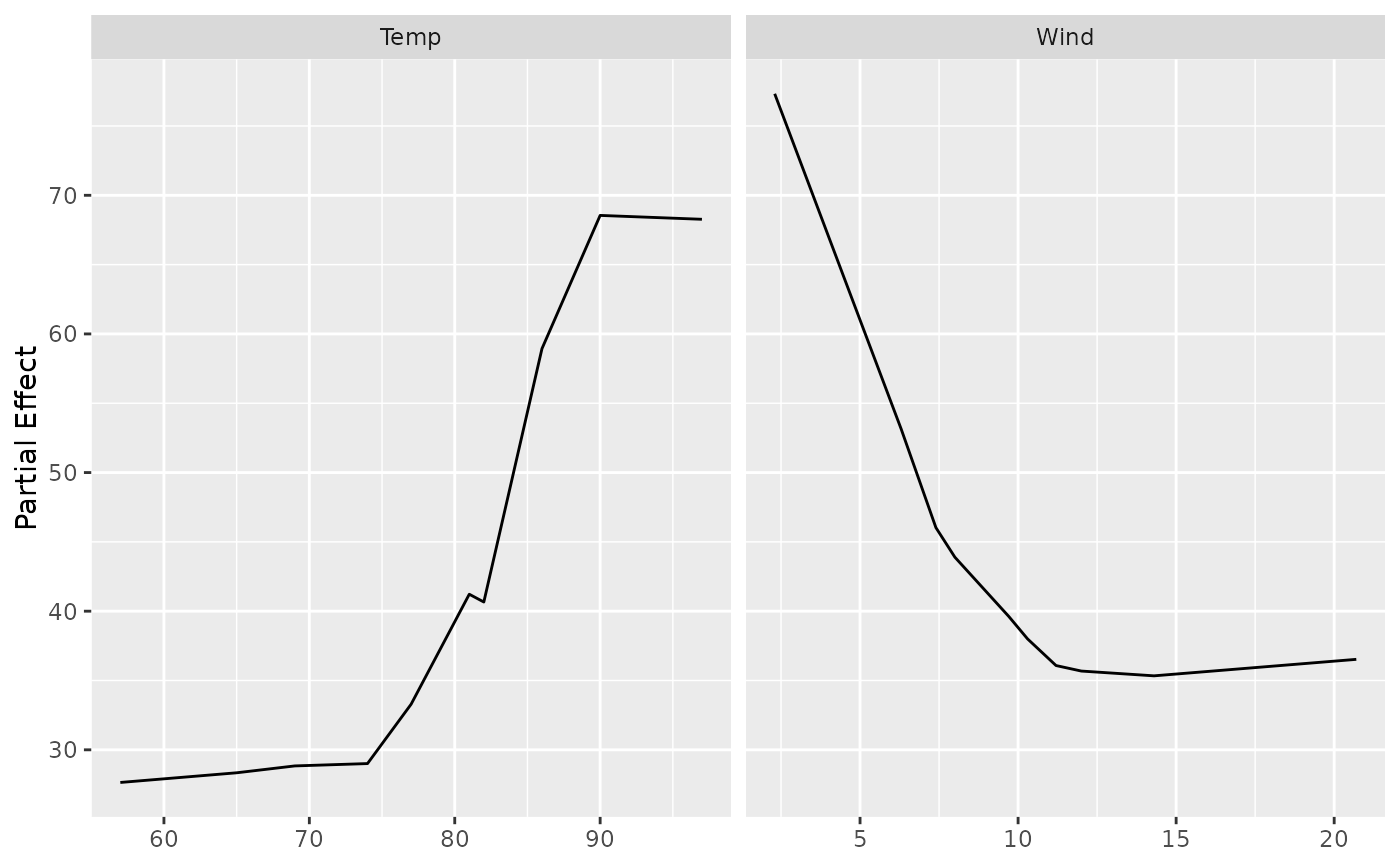
For a standard regression or classification forest, continuous predictors
are drawn as line plots and categorical predictors as box plots, both
faceted by variable name, the same arrangement as
plot.gg_partial. The categorical data hold one prediction
per training observation per level, not their average, so each box shows
the spread of the prediction at that level and its middle line the median.
For a survival forest the boxes are filled by time horizon, and with
xvar2.name by the level of the second variable. When a survival
forest has both, the fill is the time horizon and each level of the second
variable gets its own panel.
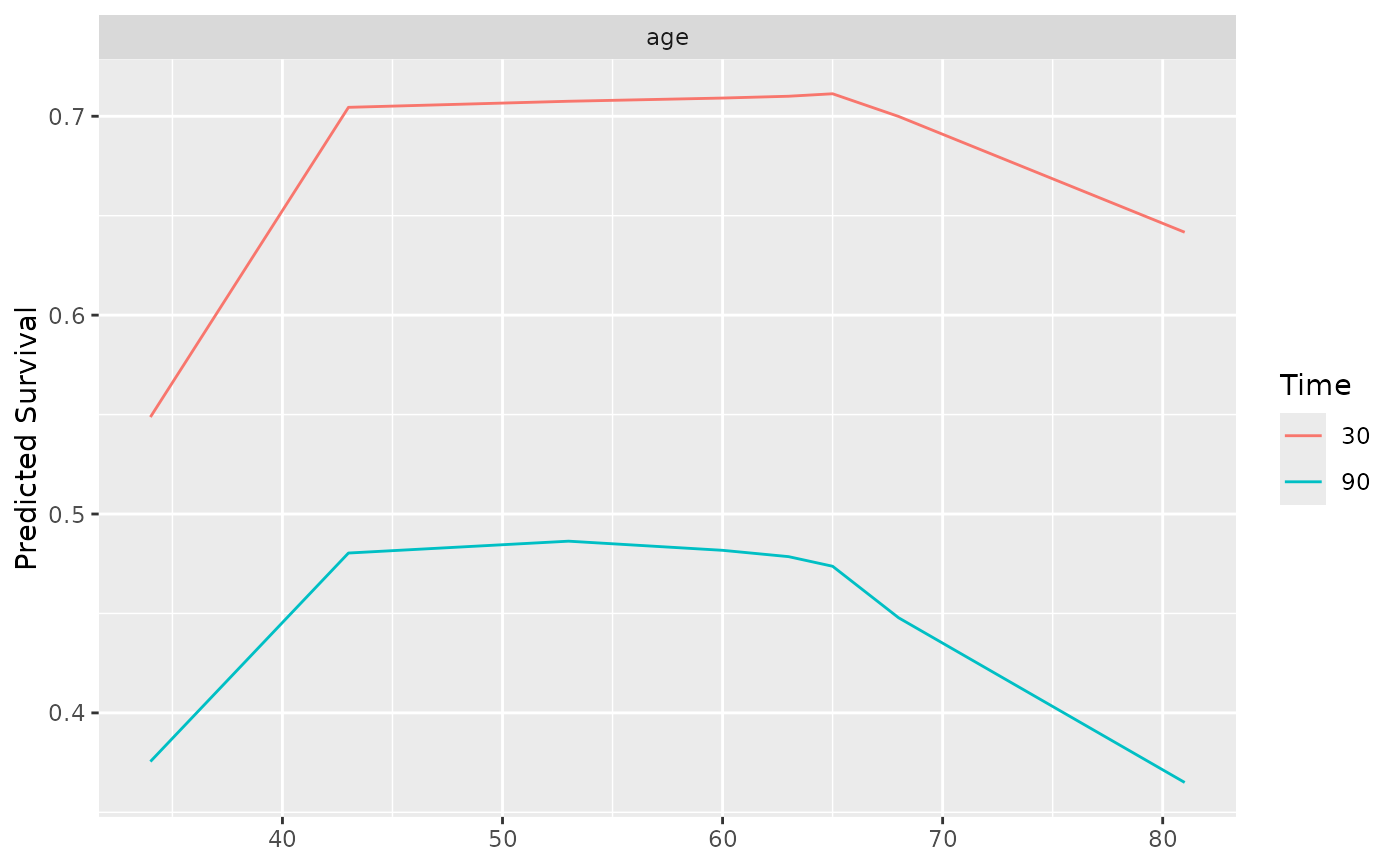
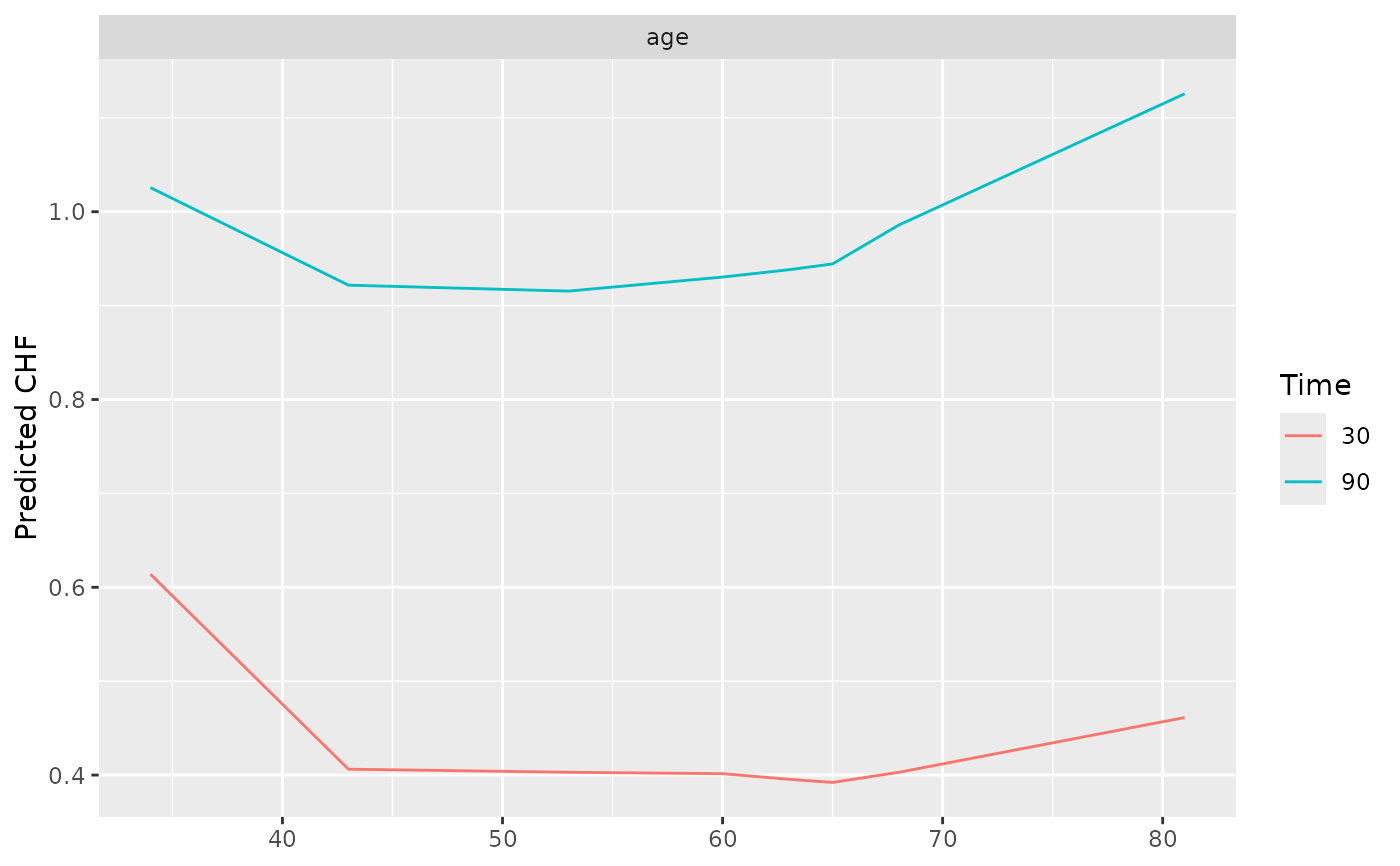
For a survival forest, each call to partial.rfsrc returns a predicted
quantity (survival probability, cumulative hazard function, or mortality) at
one or more chosen time horizons. When a time column is present in
the data, each horizon becomes a separate colored curve over the predictor's
value, still faceted by variable. Mortality has no time horizon, so it is
drawn as a single curve. The y-axis label (“Predicted
Survival”, “Predicted CHF”, or “Predicted Mortality”) tracks
the partial.type attribute set by gg_partial_rfsrc().
For a two-variable interaction surface (when xvar2.name was supplied
to gg_partial_rfsrc), the secondary variable's levels become
separate colored lines, faceted by the primary predictor. On a survival
forest the color is already the time horizon, so each level of the secondary
variable gets its own panel instead, as in the categorical panel.
Examples
## ------------------------------------------------------------
## Regression forest -- one continuous curve per variable
## ------------------------------------------------------------
set.seed(42)
airq <- na.omit(airquality)
rfsrc_airq <- randomForestSRC::rfsrc(Ozone ~ ., data = airq, ntree = 50)
pd <- gg_partial_rfsrc(rfsrc_airq, xvar.names = c("Wind", "Temp"),
n_eval = 10)
plot(pd)
 # \donttest{
## ------------------------------------------------------------
## Survival forest -- one curve per requested time horizon,
## faceted by variable. Y-axis label tracks `partial.type`.
## ------------------------------------------------------------
# randomForestSRC's formula parser requires the unqualified Surv() symbol;
# it Depends on `survival`, so Surv is on the search path once
# randomForestSRC is loaded.
data(veteran, package = "randomForestSRC")
set.seed(42)
rfsrc_v <- randomForestSRC::rfsrc(Surv(time, status) ~ .,
data = veteran, ntree = 50)
ti <- rfsrc_v$time.interest
t30 <- ti[which.min(abs(ti - 30))]
t90 <- ti[which.min(abs(ti - 90))]
# Default partial.type = "surv" -> y-axis "Predicted Survival"
pd_s <- gg_partial_rfsrc(rfsrc_v, xvar.names = "age",
partial.time = c(t30, t90), n_eval = 8)
plot(pd_s)
 # partial.type = "chf" -> y-axis "Predicted CHF"
pd_c <- gg_partial_rfsrc(rfsrc_v, xvar.names = "age",
partial.time = c(t30, t90),
partial.type = "chf", n_eval = 8)
plot(pd_c)
 # }