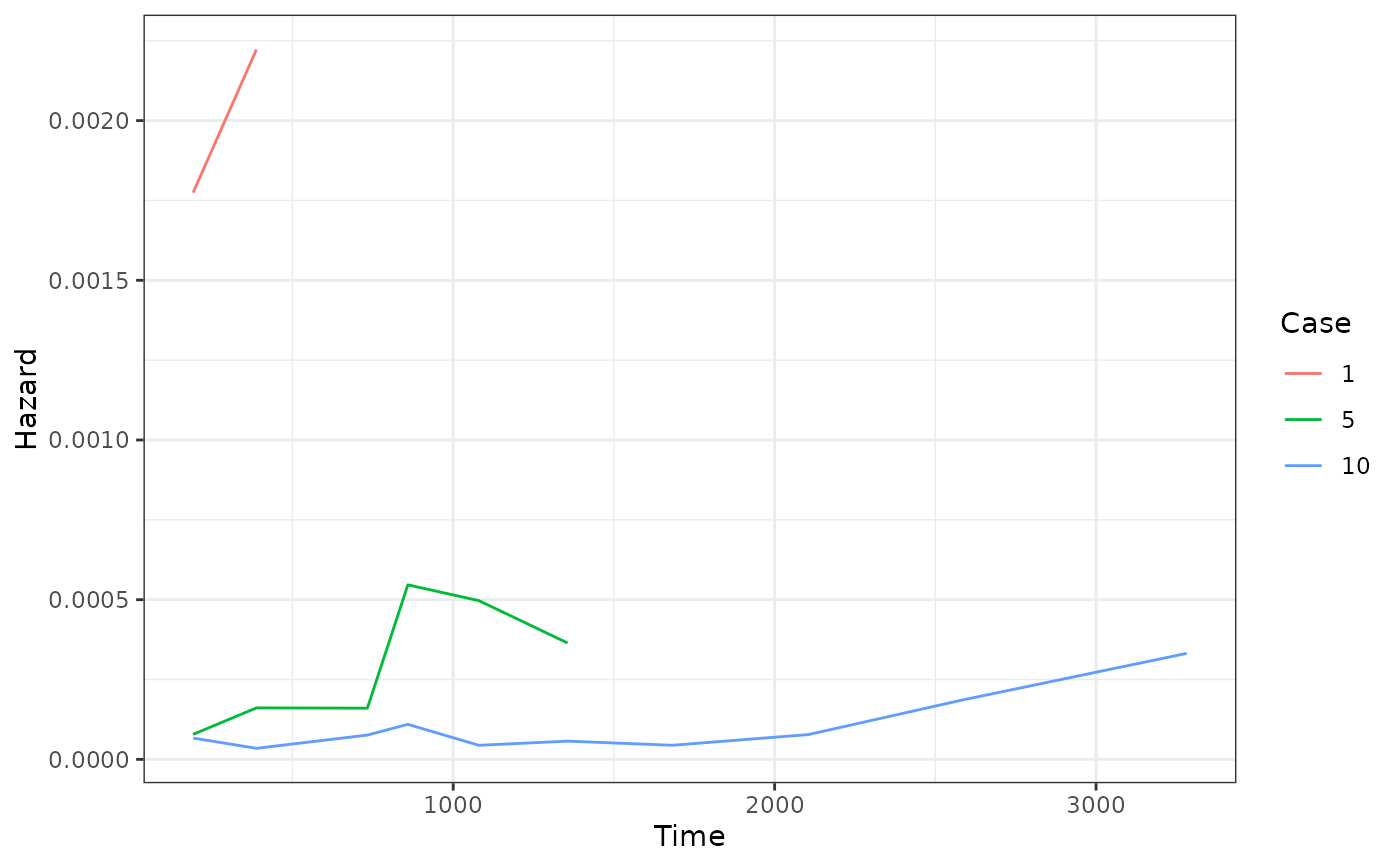
Draws case-specific ensemble curves from a gg_rhf() object: hazard
(default) or cumulative hazard, one line per case selected by idx.
Usage
# S3 method for class 'gg_rhf'
plot(x, idx = NULL, hazard.only = TRUE, ...)
Arguments
- x
A
gg_rhfobject fromgg_rhf().- idx
Integer vector of case ids (matched against the
idcolumn) to draw.NULL(default) draws every case.- hazard.only
Logical;
TRUE(default) plots the hazard,FALSEplots the cumulative hazard.- ...
Not currently used.
Details
Cells the forest left undefined are dropped before drawing. From
randomForestRHF 2.0.0 the hazard is NA outside each case's observed
(start, stop] path, so a hazard curve ends with that case's
follow-up, and a case whose hazard is masked throughout is left out of the
legend rather than shown as an empty one. From 2.0.3 the cumulative hazard
is masked too, though on a different rule: it is NA after each case's
final stop, and stays flat through an internal gap. So hazard.only = FALSE
also ends each curve with that case's follow-up, but it keeps the grid
points a gap would have cost the hazard panel.
Examples
# \donttest{
if (requireNamespace("randomForestRHF", quietly = TRUE)) {
data(pbc, package = "randomForestSRC")
d <- randomForestRHF::convert.counting(
survival::Surv(days, status) ~ ., na.omit(pbc))
o <- randomForestRHF::rhf("Surv(id, start, stop, event) ~ .", d, ntree = 30)
plot(gg_rhf(o), idx = c(1, 5, 10))
}
 # }
# }