Validates and orders a long-format standardized-mean-difference data frame
for a covariate balance plot, and returns an hv_balance object.
Call plot.hv_balance on the result to obtain a bare
ggplot2 object that you can decorate with colour, shape, axis scales,
and theme_hv_manuscript.
Usage
hv_balance(
  data,
  variable_col = "variable",
  group_col = "group",
  std_diff_col = "std_diff",
  var_levels = NULL,
  threshold = 10
)
Arguments
- data
A data frame in long format with one row per covariate \(\times\) group combination. Wide-format data must be reshaped first (e.g. with
tidyr::pivot_longer()).- variable_col
Name of the column containing covariate labels. Default
"variable".- group_col
Name of the column identifying the comparison group (e.g.
"Before match"/"After match"). Default"group".- std_diff_col
Name of the numeric column holding standardized mean difference values. Default
"std_diff".- var_levels
Character vector controlling the display order of covariates on the y-axis. The first element appears at the bottom. Defaults to the order of first appearance in
data[[variable_col]].- threshold
Numeric; absolute SMD value at which dotted reference lines are drawn (\(\pm\)
threshold). Default10.
Value
An object of class c("hv_balance", "hv_data") — a list
with three elements:
$dataThe input data frame with a
cb_indexcolumn added for y-axis positioning.$metaNamed list:
variable_col,group_col,std_diff_col,var_levels,threshold,n_vars,n_groups.$tablesEmpty list (no accessory tables).
Examples
library(ggplot2)
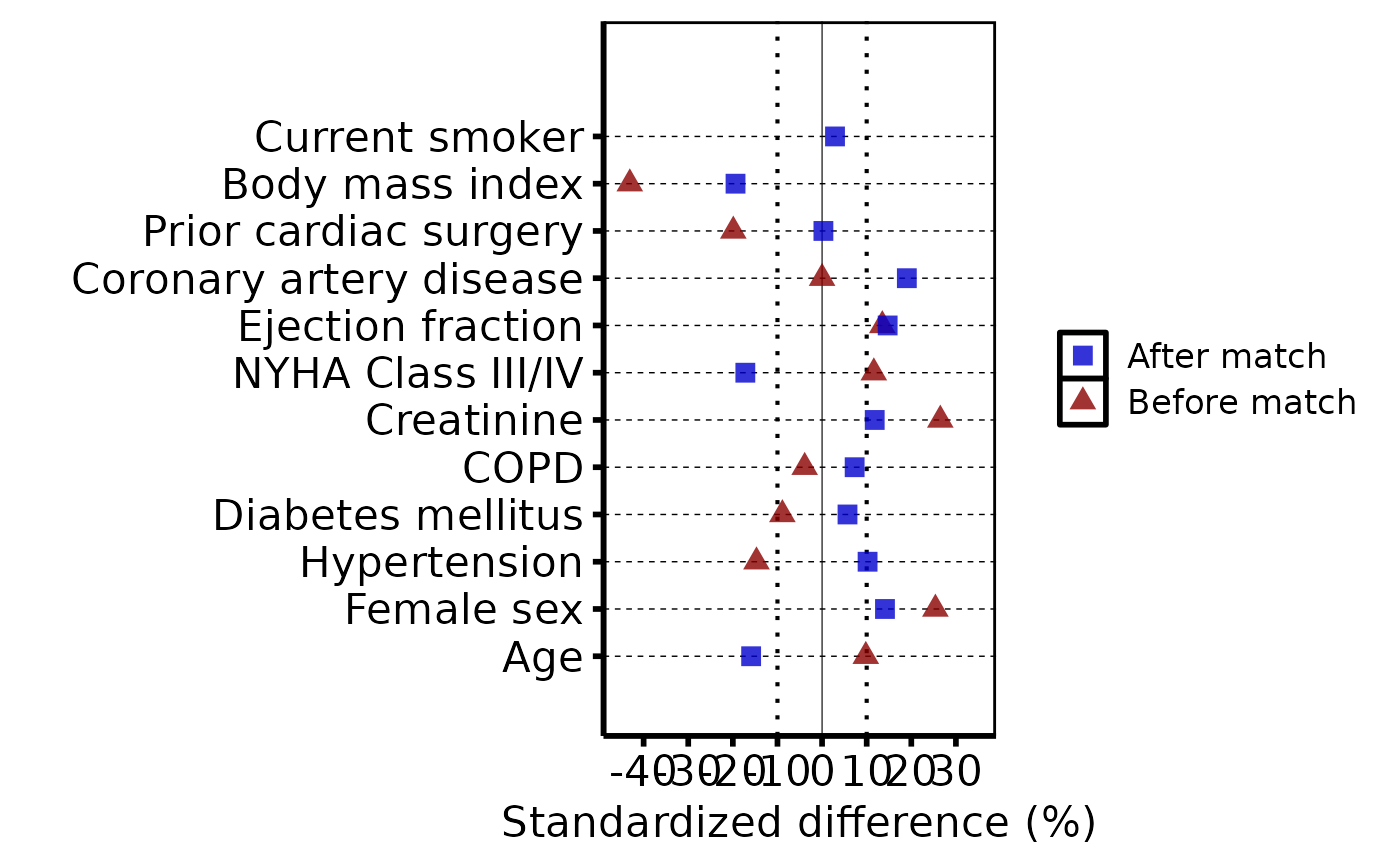
dta <- sample_covariate_balance_data()
# 1. Build data object
cb <- hv_balance(dta)
cb # prints variable count, group count, threshold
#> <hv_balance>
#> Variables : 12
#> Groups : 2 (Before match, After match)
#> SMD col : std_diff
#> Threshold : ±10
# 2. Bare plot -- undecorated ggplot returned by plot.hv_balance
p <- plot(cb)
# 3. Decorate: colour/shape palettes, x-axis range, labels, theme
p +
scale_color_manual(
values = c("Before match" = "red4", "After match" = "blue3"),
name = NULL
) +
scale_shape_manual(
values = c("Before match" = 17L, "After match" = 15L),
name = NULL
) +
scale_x_continuous(limits = c(-45, 35), breaks = seq(-40, 30, 10)) +
labs(x = "Standardized difference (%)", y = "") +
theme_hv_poster()
#> Warning: Removed 1 row containing missing values or values outside the scale range
#> (`geom_point()`).