Superseded.
nnt_plot() has been superseded by the S3 constructor hv_nnt() plus
plot.hv_nnt().
Pass the nntout dataset and plot NNT (or ARR) over time. Add
lower_col/upper_col for a confidence band. Covers the NNT component
of tp.hp.numtreat.survdiff.matched.sas.
SAS context: The SAS template computes NNT at discrete time points
(1, 5, 10, 15, 20 years) from the HAZDIFL macro output, then connects them
as a curve. Export the NNT dataset and pass it directly, or use
sample_nnt_data() for examples.
Usage
nnt_plot(
  nnt_data,
  x_col = "time",
  estimate_col = "nnt",
  lower_col = NULL,
  upper_col = NULL,
  na_rm = TRUE,
  ci_alpha = 0.2,
  line_width = 1
)
Arguments
- nnt_data
Data frame of pre-computed NNT estimates. See
sample_nnt_data().- x_col
Name of the time column. Default
"time".- estimate_col
Name of the NNT column. Default
"nnt".- lower_col
Name of the lower CI column, or
NULL. DefaultNULL.- upper_col
Name of the upper CI column, or
NULL. DefaultNULL.- na_rm
Remove
NANNT values (undefined when ARR \(\approx\) 0) before plotting. DefaultTRUE.- ci_alpha
Transparency of the CI ribbon. Default
0.20.- line_width
Line width. Default
1.0.
Value
A ggplot2::ggplot() object.
Examples
library(ggplot2)
nnt_dat <- sample_nnt_data(
n = 500, time_max = 20,
groups = c("SVG" = 1.0, "ITA" = 0.75)
)
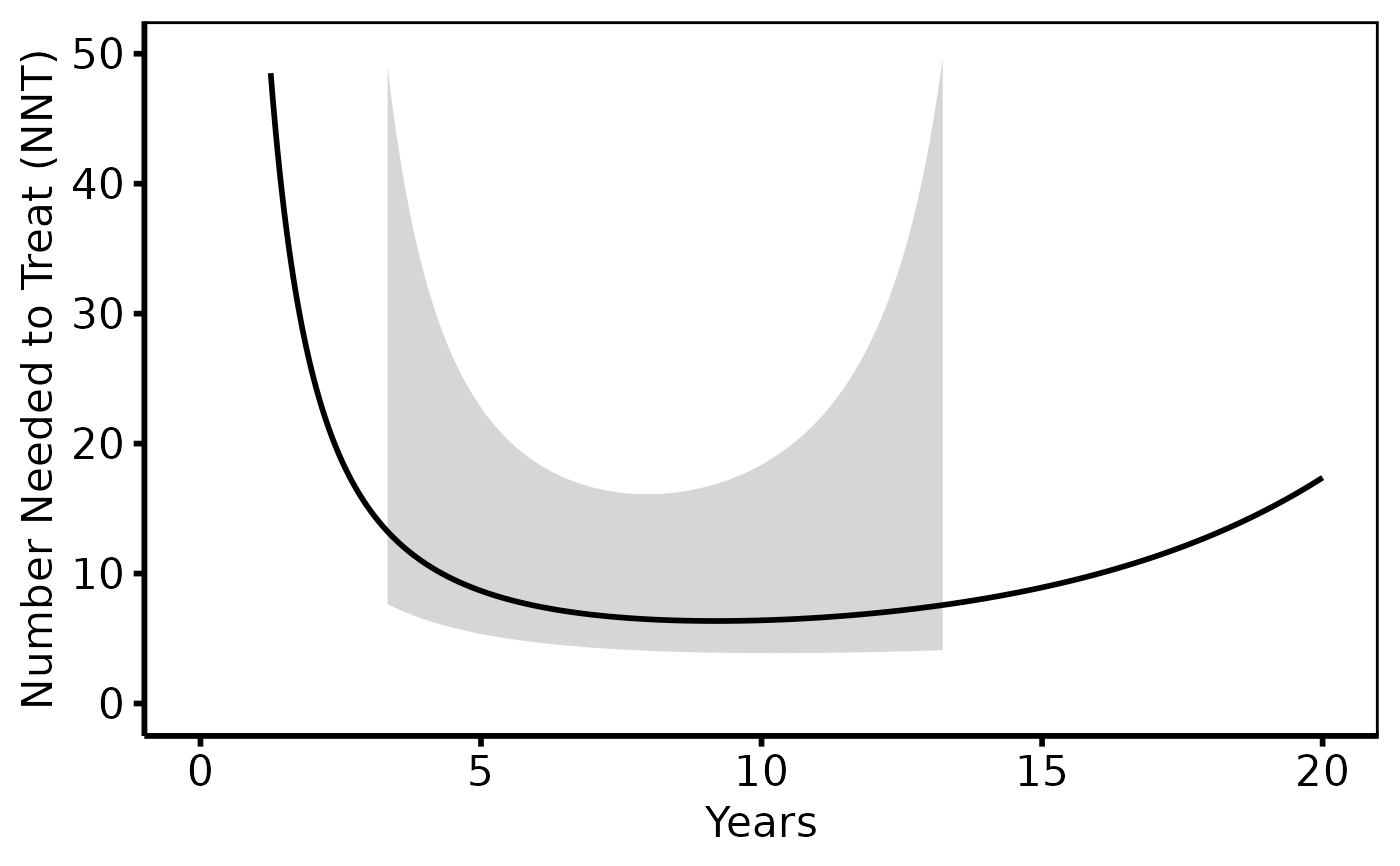
# --- (1) NNT curve over time --------------------------------------------
# Matches tp.hp.numtreat.survdiff.matched.sas (NNT panel).
# NNT decreases as the treatment benefit accumulates over time.
nnt_plot(
nnt_dat,
lower_col = "nnt_lower",
upper_col = "nnt_upper"
) +
scale_colour_manual(values = c("steelblue"), guide = "none") +
scale_fill_manual(values = c("steelblue"), guide = "none") +
scale_x_continuous(limits = c(0, 20), breaks = seq(0, 20, 5)) +
scale_y_continuous(limits = c(0, 50), breaks = seq(0, 50, 10)) +
labs(x = "Years", y = "Number Needed to Treat (NNT)") +
theme_hv_poster()
#> Warning: Removed 248 rows containing missing values or values outside the scale range
#> (`geom_ribbon()`).
#> Warning: Removed 27 rows containing missing values or values outside the scale range
#> (`geom_line()`).
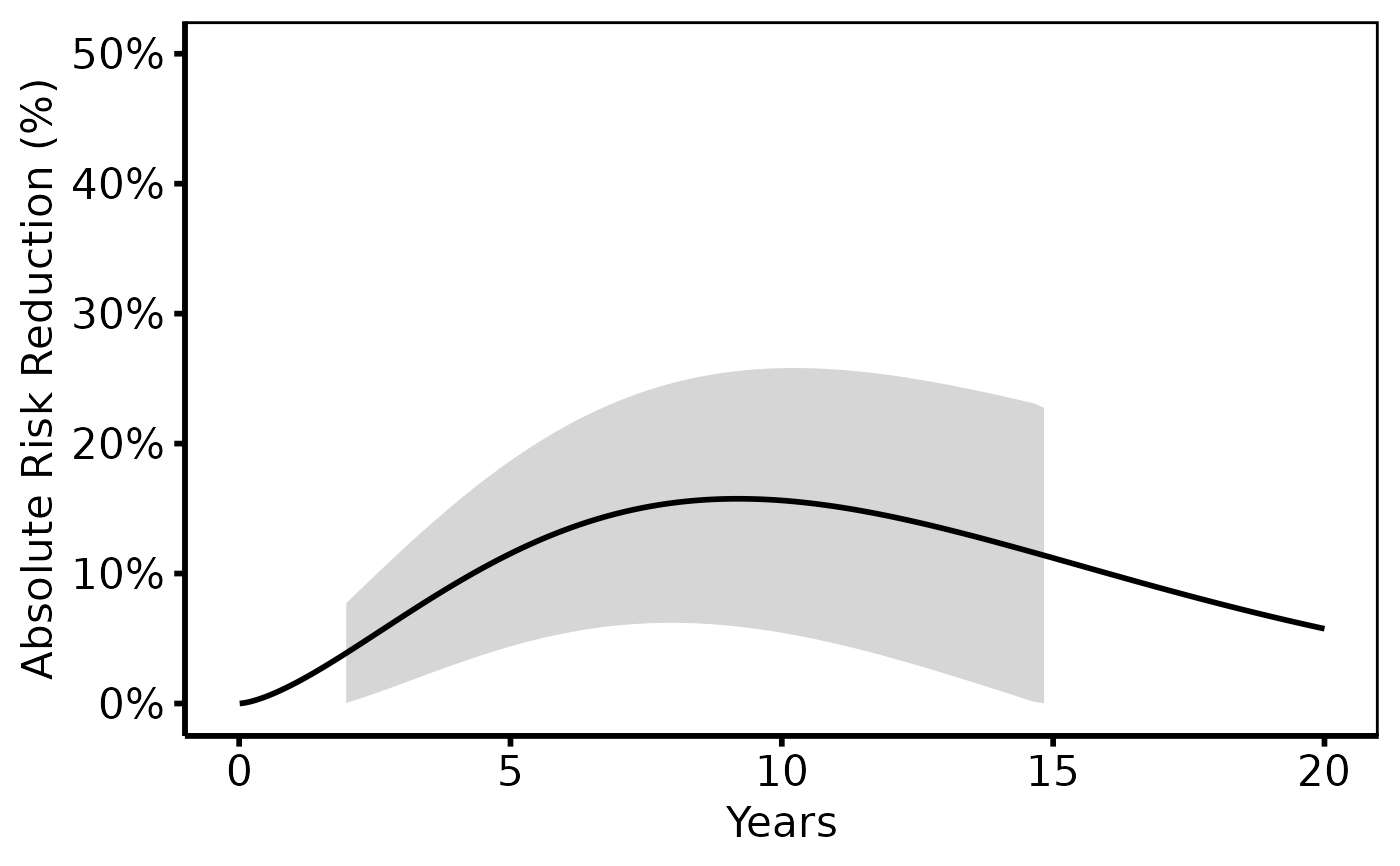
 # --- (2) ARR curve over time (same data, different column) ---------------
# Absolute risk reduction (%) increases over time as survival curves diverge.
nnt_plot(
nnt_dat,
estimate_col = "arr",
lower_col = "arr_lower",
upper_col = "arr_upper"
) +
scale_colour_manual(values = c("firebrick"), guide = "none") +
scale_fill_manual(values = c("firebrick"), guide = "none") +
scale_x_continuous(limits = c(0, 20), breaks = seq(0, 20, 5)) +
scale_y_continuous(limits = c(0, 50),
labels = function(x) paste0(x, "%")) +
labs(x = "Years", y = "Absolute Risk Reduction (%)") +
theme_hv_poster()
#> Warning: Removed 178 rows containing missing values or values outside the scale range
#> (`geom_ribbon()`).
# --- (2) ARR curve over time (same data, different column) ---------------
# Absolute risk reduction (%) increases over time as survival curves diverge.
nnt_plot(
nnt_dat,
estimate_col = "arr",
lower_col = "arr_lower",
upper_col = "arr_upper"
) +
scale_colour_manual(values = c("firebrick"), guide = "none") +
scale_fill_manual(values = c("firebrick"), guide = "none") +
scale_x_continuous(limits = c(0, 20), breaks = seq(0, 20, 5)) +
scale_y_continuous(limits = c(0, 50),
labels = function(x) paste0(x, "%")) +
labs(x = "Years", y = "Absolute Risk Reduction (%)") +
theme_hv_poster()
#> Warning: Removed 178 rows containing missing values or values outside the scale range
#> (`geom_ribbon()`).