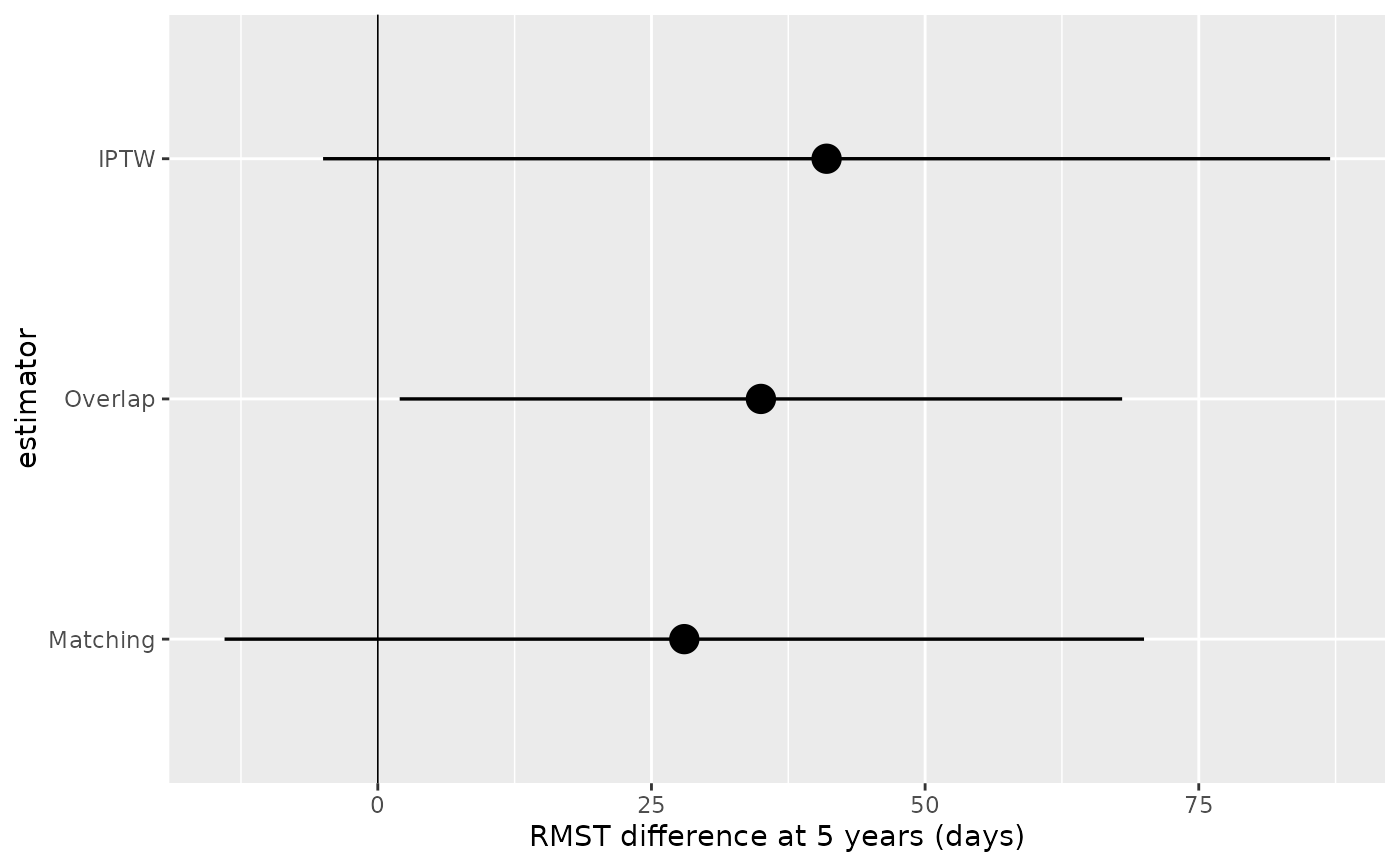
Builds a bare dot-and-whisker ggplot2 object from an
hv_rmst_contrast() object. Estimators run down the y axis with the first
level at the top, so the plot reads in the order supplied. A solid vertical
line marks zero (no difference). Add colors, scales and a theme with +.
Usage
# S3 method for class 'hv_rmst_contrast'
plot(
  x,
  point_size = 3,
  linewidth = 0.6,
  zero_linetype = "solid",
  zero_linewidth = 0.3,
  x_label = "RMST difference (days)",
  ...
)
Arguments
- x
An
hv_rmst_contrastobject.- point_size
Point size passed to
geom_pointrange(). Default3.- linewidth
Whisker line width. Default
0.6.- zero_linetype
Linetype of the zero reference line. Default
"solid".- zero_linewidth
Line width of the zero reference line. Default
0.3.- x_label
X axis label. Default
"RMST difference (days)".- ...
Ignored; present for S3 consistency.
Value
A bare ggplot2::ggplot() object.
See also
Other Propensity Score & Matching:
hv_mirror_hist(),
hv_rmst_contrast(),
hv_rmst_curves(),
plot.hv_mirror_hist(),
plot.hv_rmst_curves(),
sample_covariate_balance_data()
Examples
est <- data.frame(
  estimator = c("IPTW", "Overlap", "Matching"),
  diff_days = c(41, 35, 28),
  lo_days   = c(-5, 2, -14),
  hi_days   = c(87, 68, 70)
)
plot(hv_rmst_contrast(est), x_label = "RMST difference at 5 years (days)")