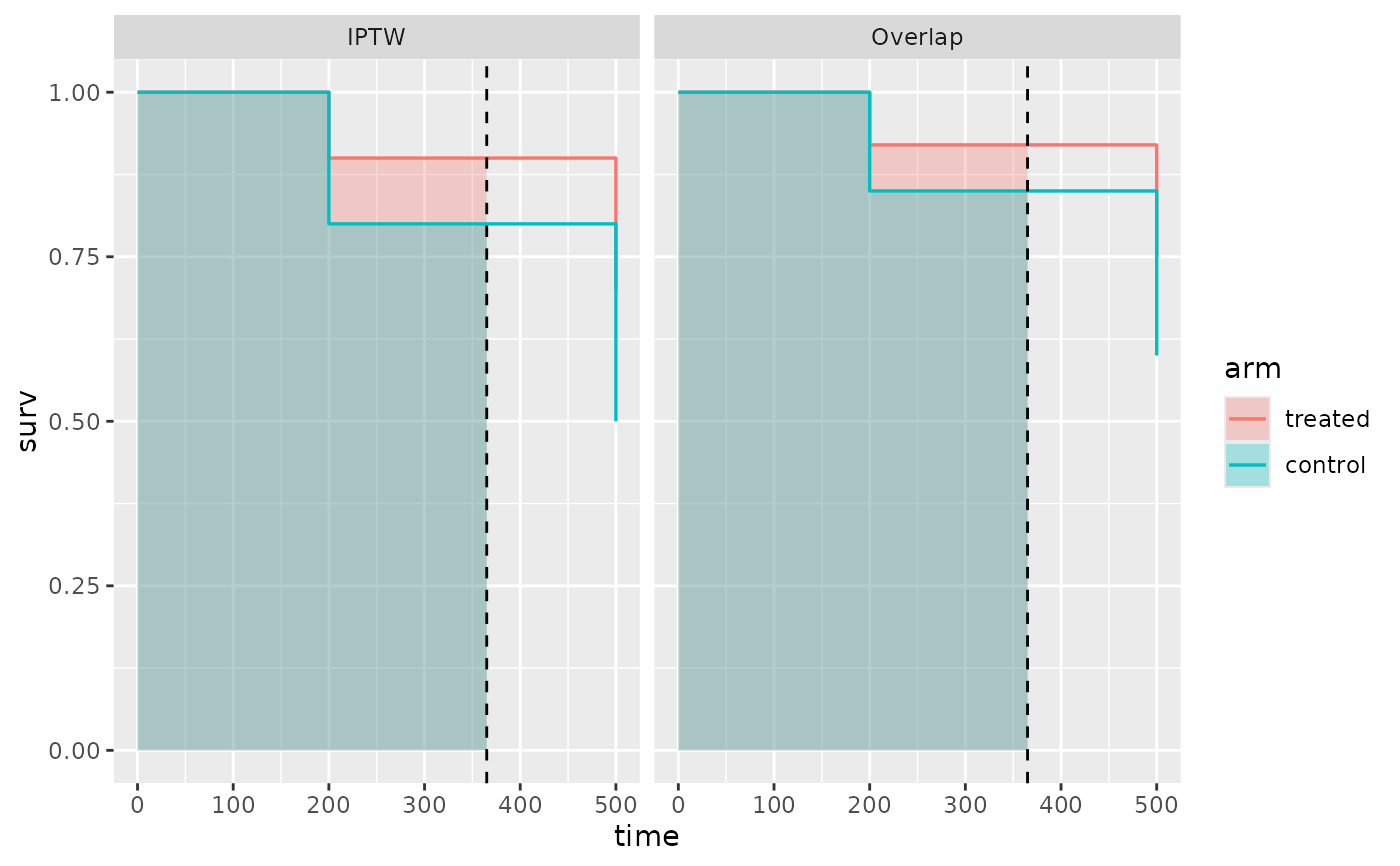
Builds a bare ggplot2 object from an hv_rmst_curves() object: weighted
Kaplan-Meier step curves, one facet per estimator, colored by arm. When
tau was supplied, the area under each curve up to tau is shaded
(geom_ribbon() over a staircase polygon, so the shading follows the steps
exactly) and a vertical line marks tau. When estimates was supplied, the
top right of each facet carries the RMST difference and interval. Color and
fill both map to arm: set them together with scale_color_*() and
scale_fill_*().
Usage
# S3 method for class 'hv_rmst_curves'
plot(
  x,
  shade_alpha = 0.2,
  linewidth = 0.6,
  tau_linetype = "dashed",
  label_size = 3,
  ...
)Value
A bare ggplot2::ggplot() object.
See also
Other Propensity Score & Matching:
hv_mirror_hist(),
hv_rmst_contrast(),
hv_rmst_curves(),
plot.hv_mirror_hist(),
plot.hv_rmst_contrast(),
sample_covariate_balance_data()