dta_trends <- sample_trends_data(n = 600, seed = 42)
p_base <- plot(hv_trends(dta_trends))8 Using legends
ggplot2 (Wickham et al. 2026) places the legend outside the panel by default. For publication figures we often move it inside, drop it, or shrink it — the axis labels frequently do the identification work already. Legend behaviour is controlled through theme() (or directly via a theme’s ...), and per-aesthetic via guide =.
8.1 When to use it
A legend is the key that tells a reader which colour or shape means which group. You need one whenever the grouping is not already named on the panel, and you want it gone the moment it is. The default position, off to the right, is safe but wastes width: it shrinks the panel to make room for a box the reader glances at once. So the real decisions are where to put the legend and whether to keep it at all.
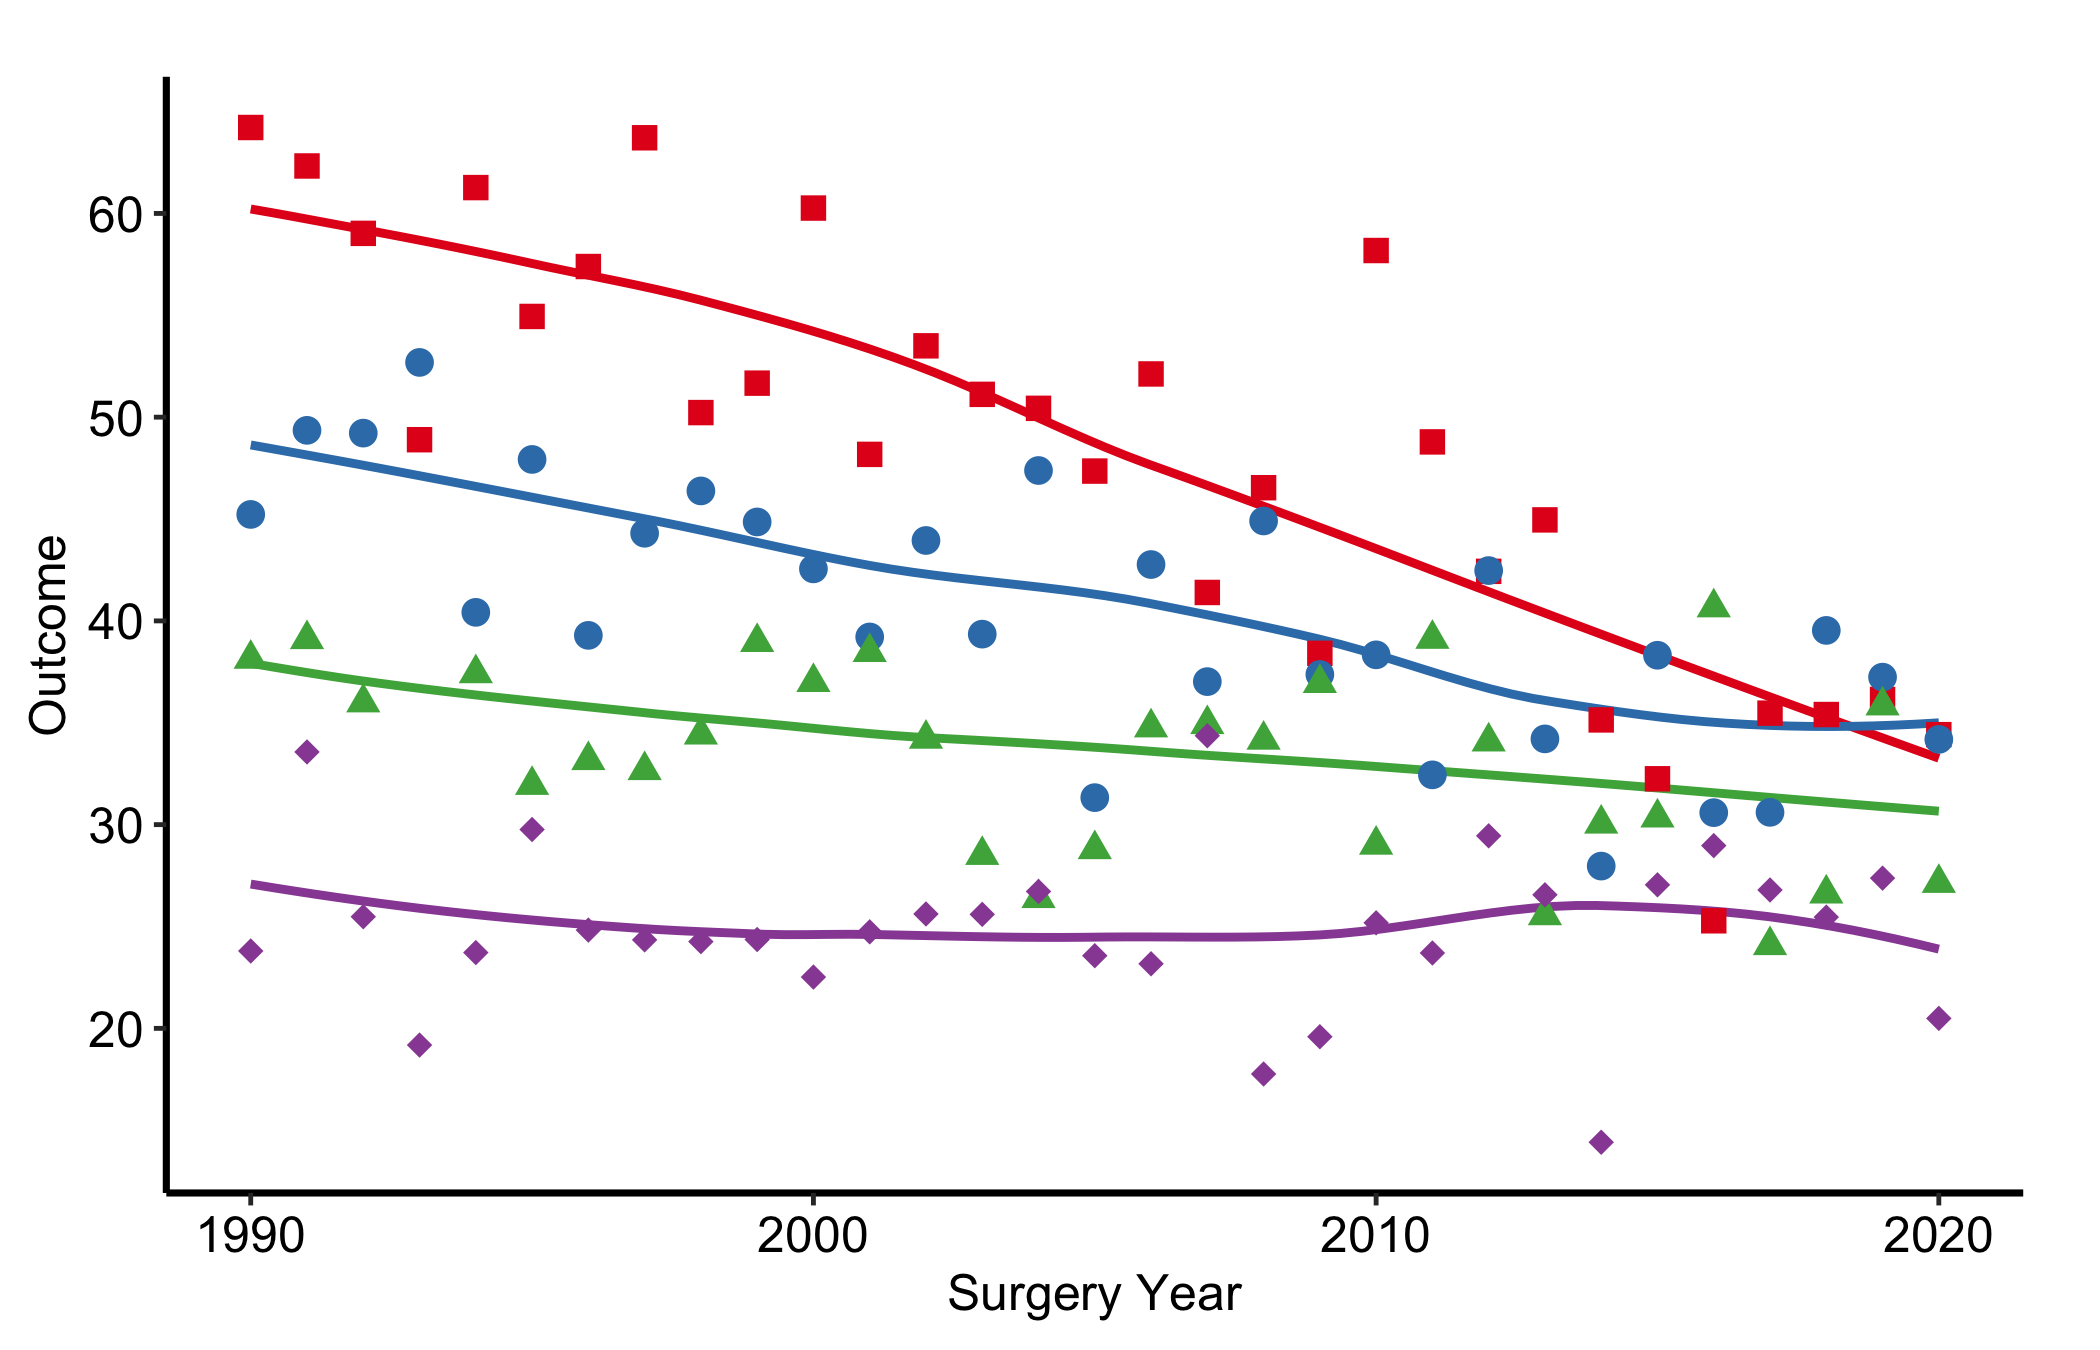
Move the legend inside the panel when there is empty space the data do not use (a survival curve leaves a wide gap in one corner) and you would rather spend that gap than narrow the plot. Move it to the bottom when the labels are long and a corner would crowd. Drop it entirely when an annotation or the axis labels already identify the groups. Shrink its text and swatches when it has to sit inside a busy panel without stealing attention from the data. We use a grouped trends plot below so there is a multi-level legend to position.
8.2 Inside the panel
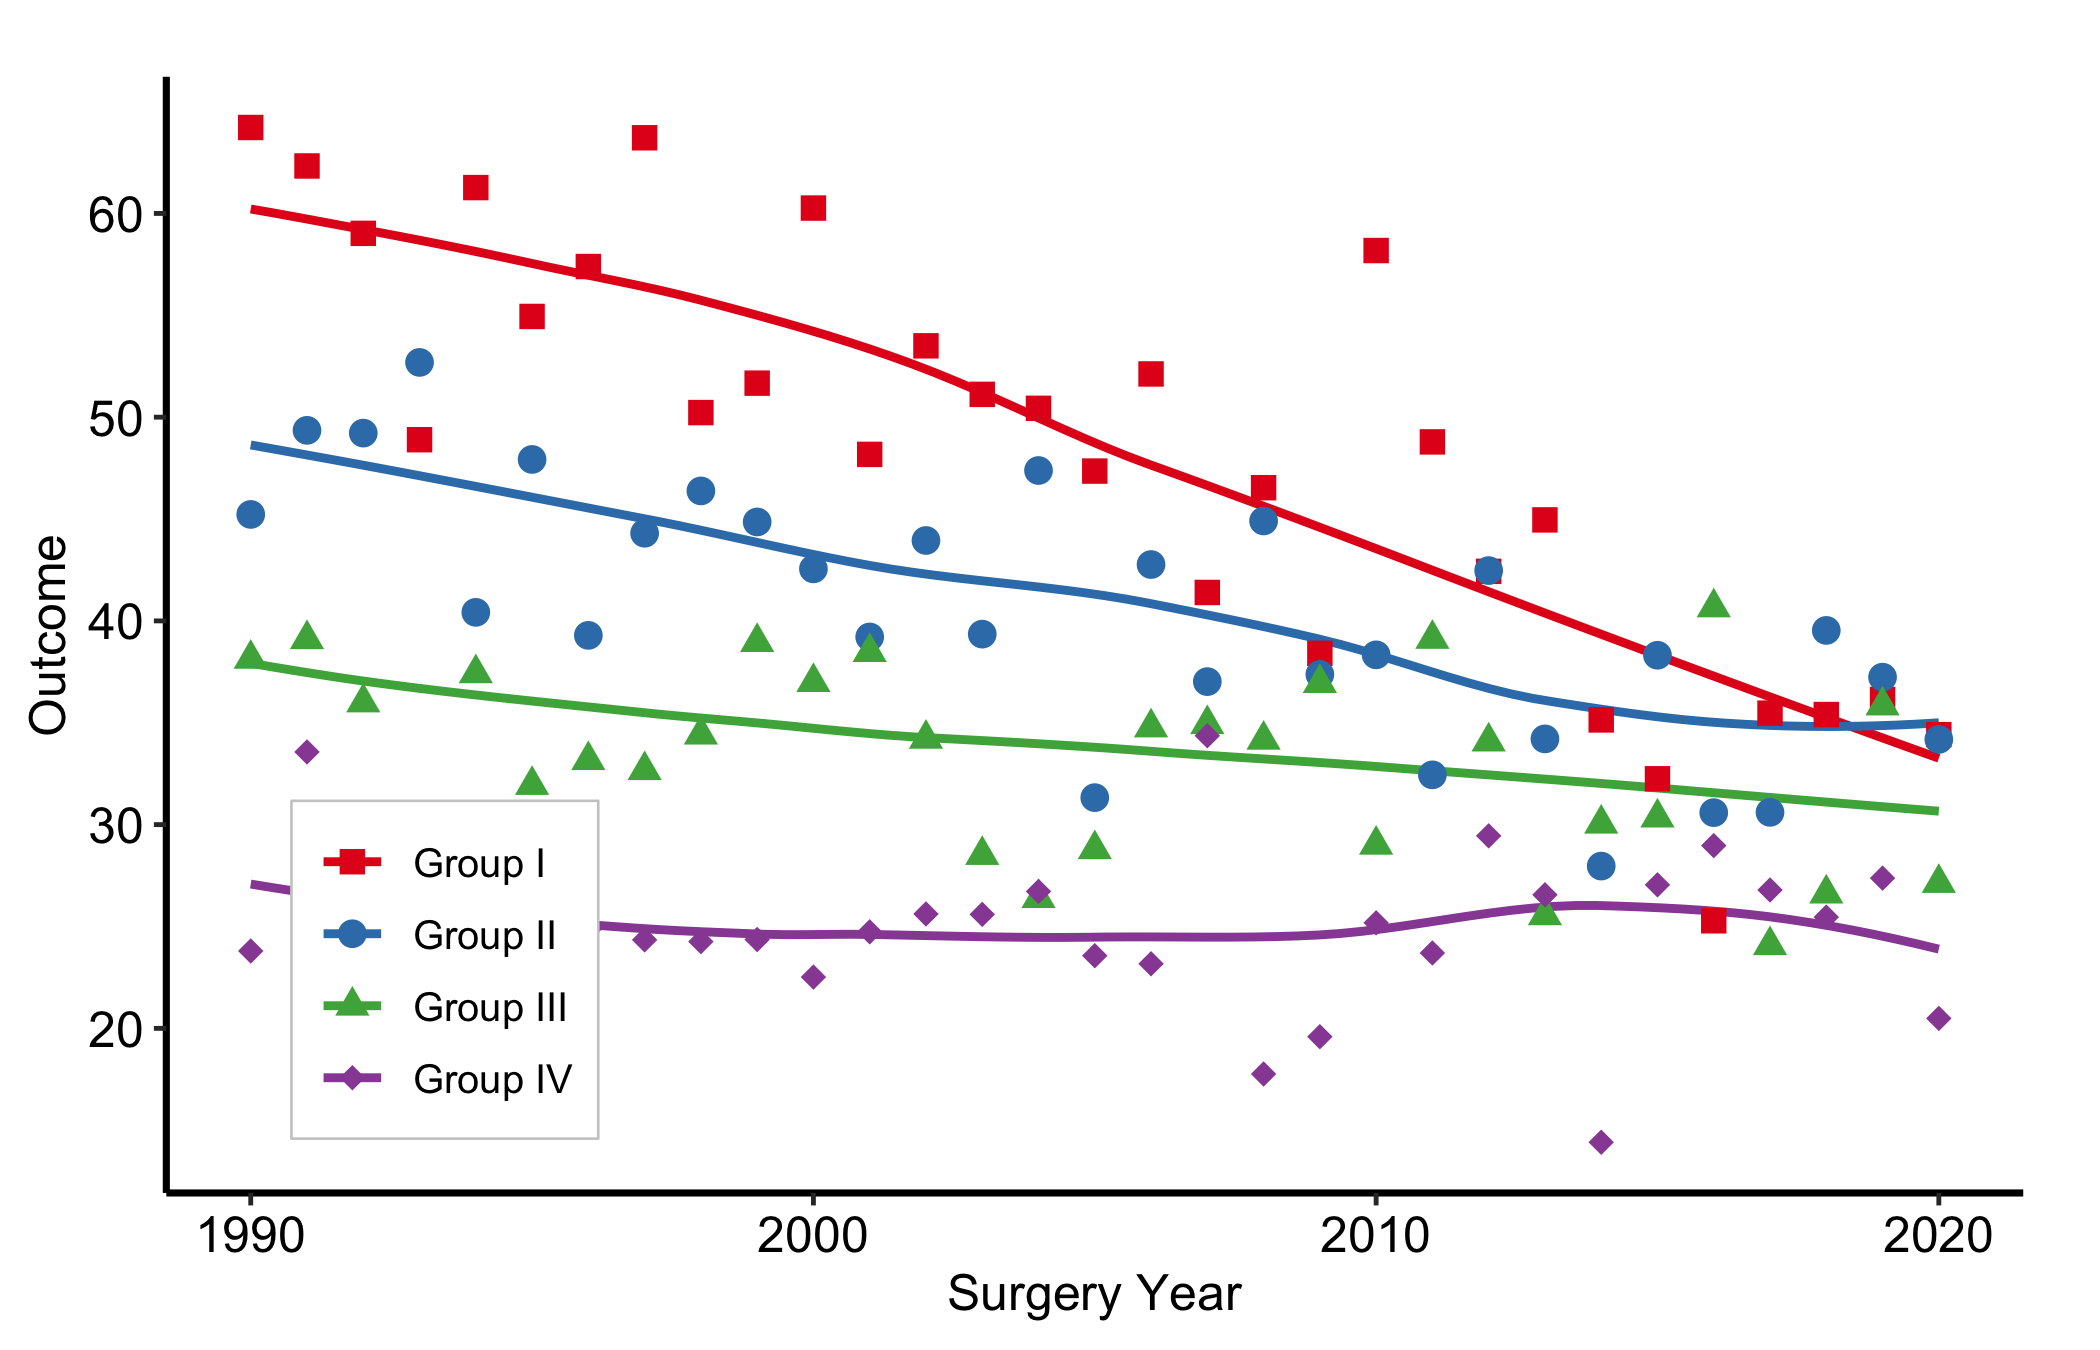
Pass fractional coordinates c(x, y) to legend.position. c(0, 0) is bottom-left; c(1, 1) is top-right. A light background box keeps it legible over data.
p_base +
  scale_colour_brewer(palette = "Set1", name = NULL) +
  scale_shape_manual(
    values = c("Group I" = 15, "Group II" = 19,
               "Group III" = 17, "Group IV" = 18),
    name = NULL
  ) +
  labs(x = "Surgery Year", y = "Outcome") +
  theme_hv_manuscript() +
  theme(
    legend.position   = c(0.15, 0.2),
    legend.background = element_rect(fill = "white", colour = "grey80",
                                     linewidth = 0.3)
  )
8.3 Automatic placement
Choosing the corner by hand means re-checking it every time the data, axis range, or cohort change – the first pitfall below. hv_legend_inside() does the choosing for you: it inspects the built plot, finds the panel corner the data leave emptiest, and anchors the legend there, falling back to an outside legend when no corner is clear. Apply it last, after the theme (which sets legend.position = "none"), so its position wins.
p_auto <- p_base +
  scale_colour_brewer(palette = "Set1", name = NULL) +
  scale_shape_manual(
    values = c("Group I" = 15, "Group II" = 19,
               "Group III" = 17, "Group IV" = 18),
    name = NULL
  ) +
  labs(x = "Surgery Year", y = "Outcome") +
  theme_hv_manuscript()

hv_legend_inside(p_auto)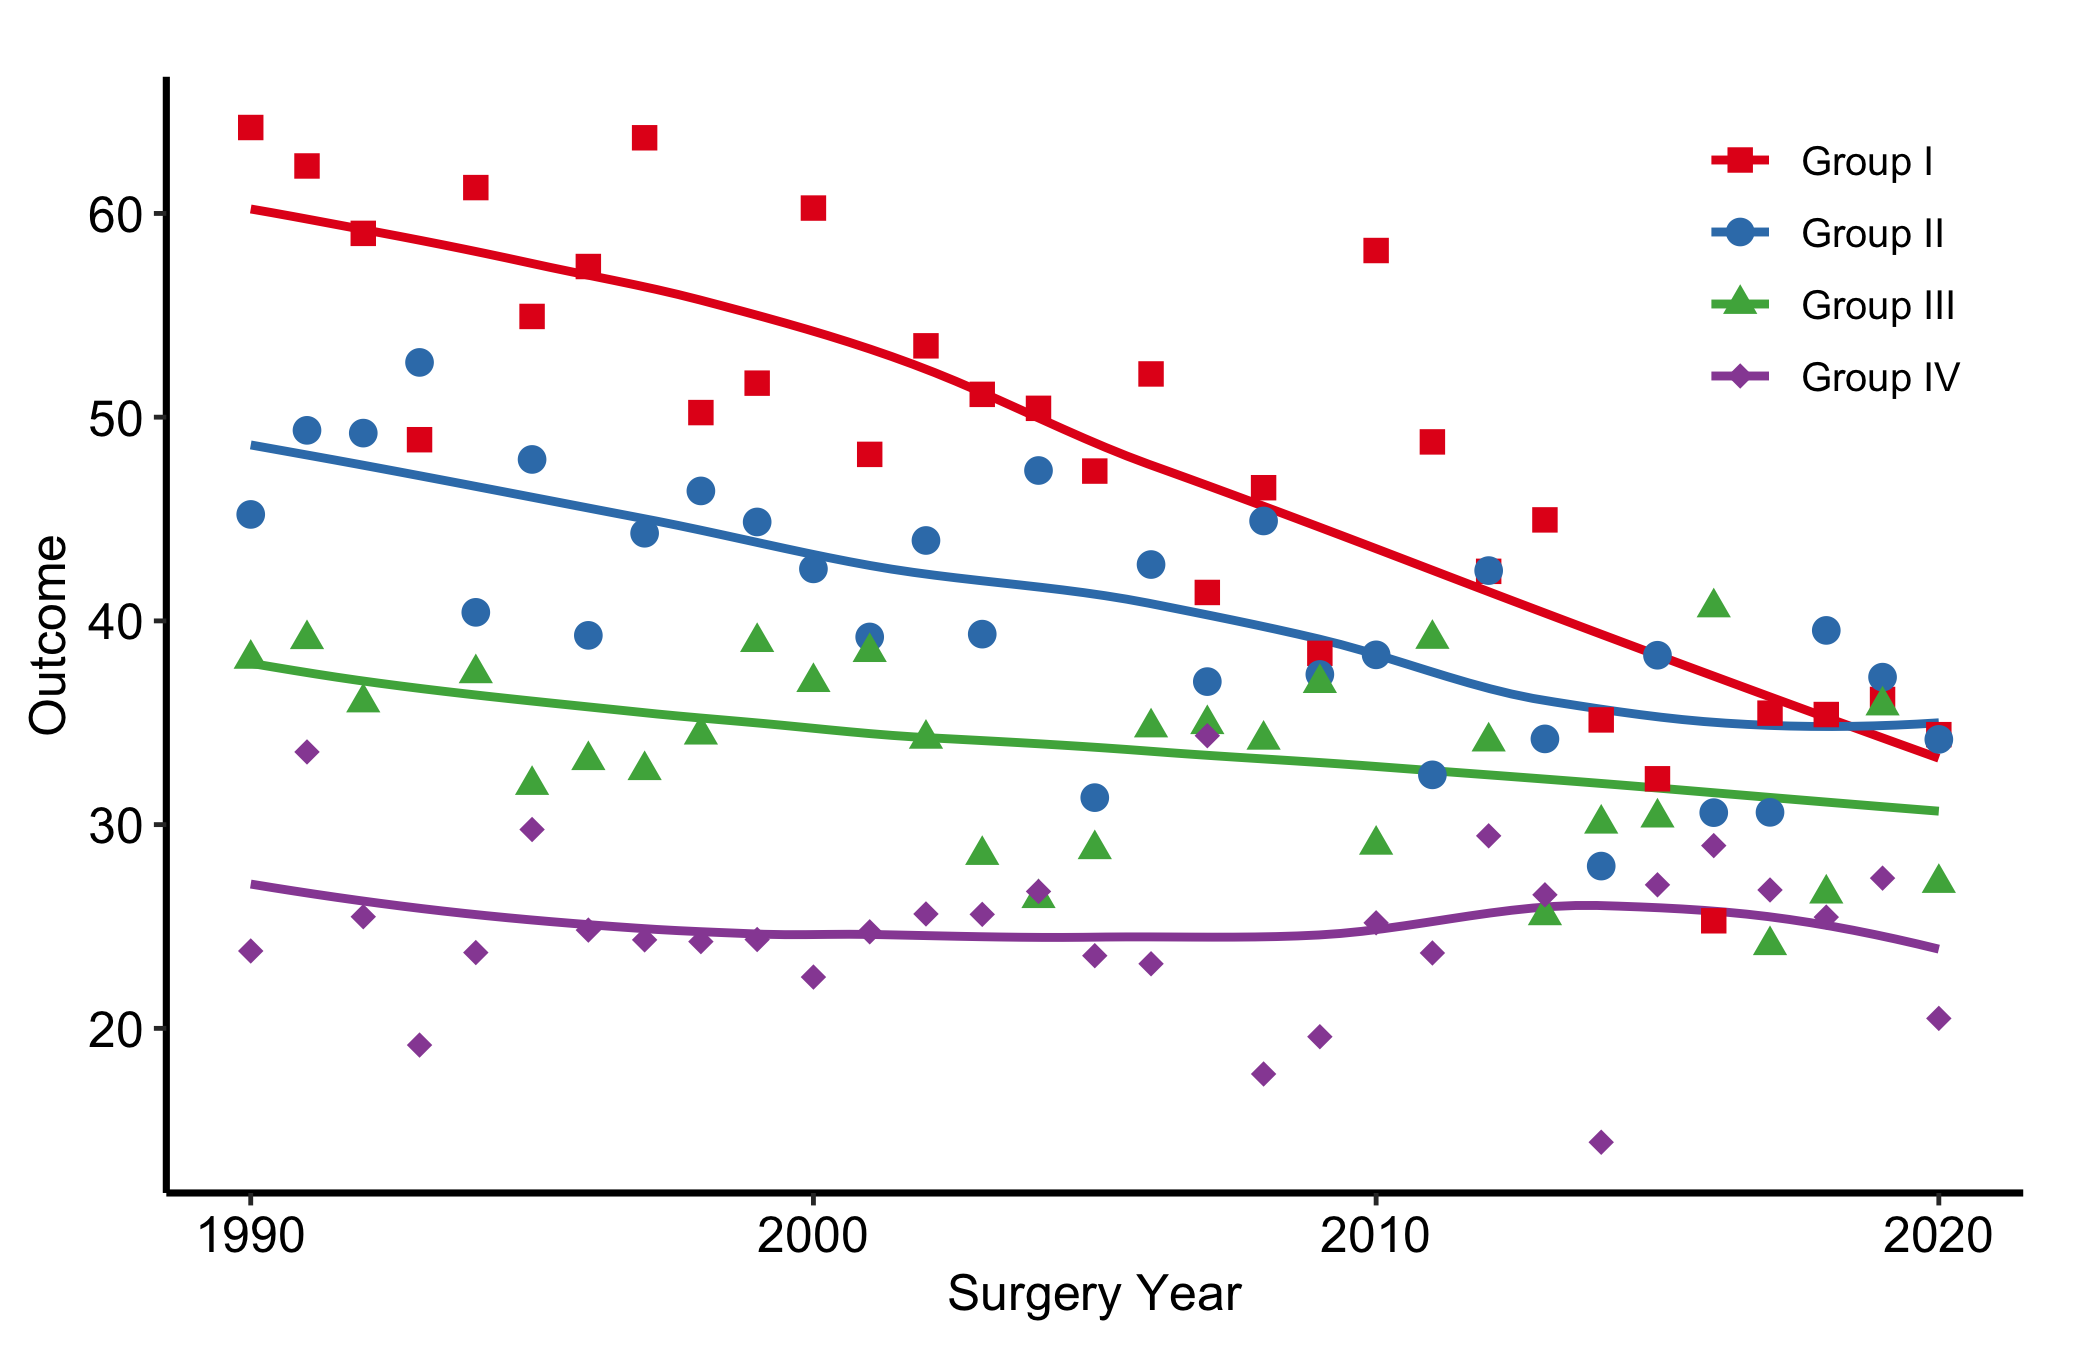
Because it reads the rendered data, the same call keeps the legend off the data after you change the cohort or axis range. On a dense panel where every corner is occupied – stratified survival or hazard curves – it returns an outside legend instead of forcing the key over the data. Add a background box with + theme(legend.background = element_rect(...)) when the chosen corner is not fully empty.
8.4 Outside the panel (explicit sides)
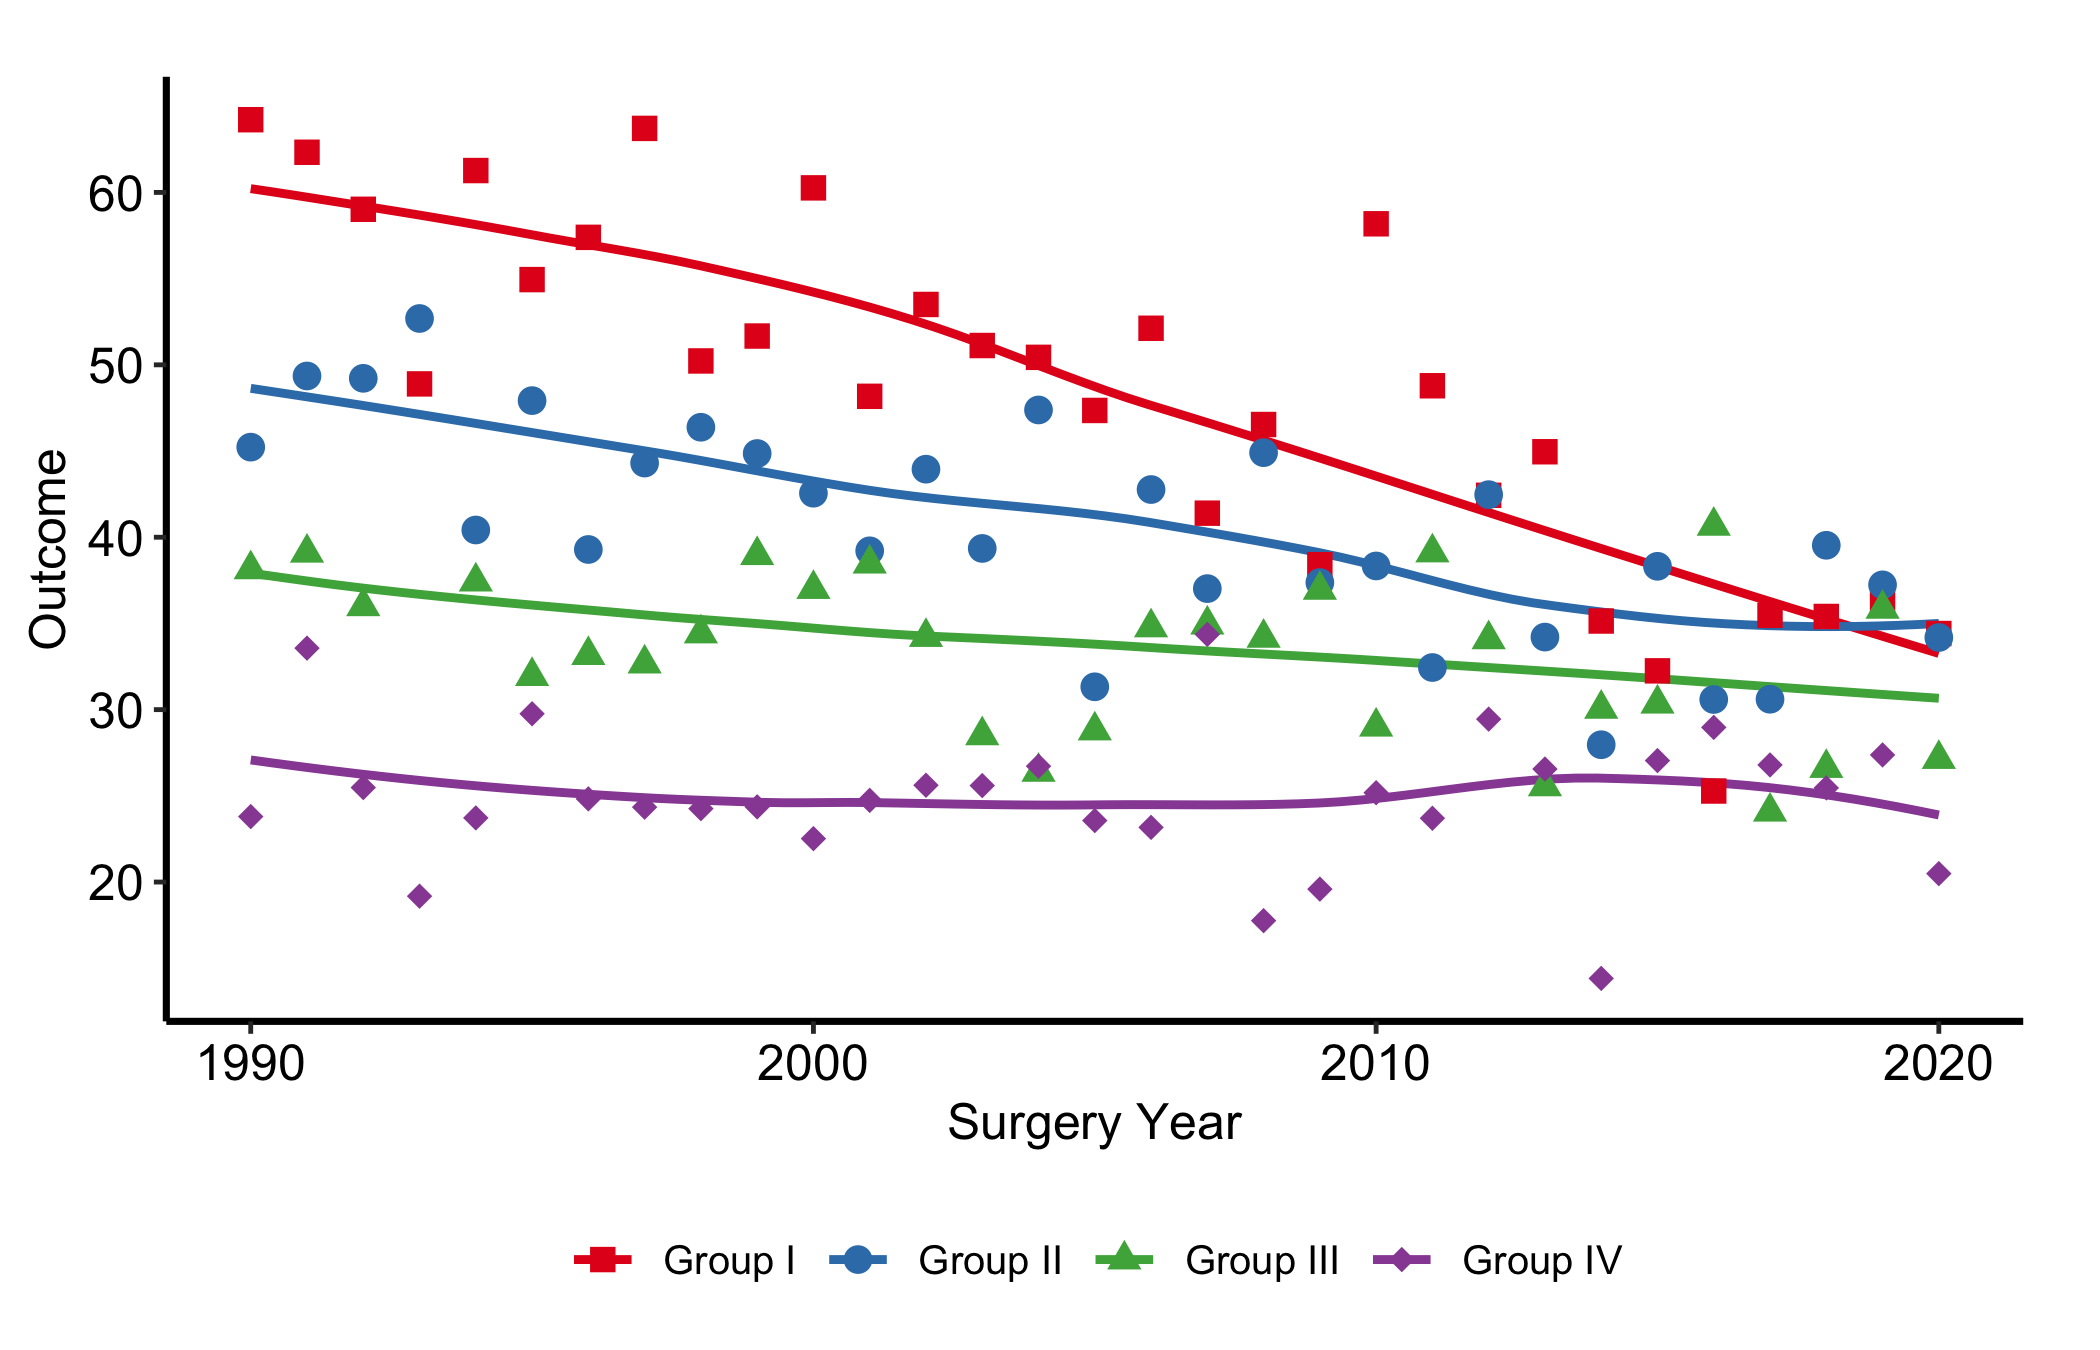
Set legend.position to "right", "left", "top", or "bottom". "bottom" with legend.direction = "horizontal" is the common choice for multi-group figures where a corner legend would crowd the panel.
p_base +
  scale_colour_brewer(palette = "Set1", name = "Group") +
  scale_shape_manual(
    values = c("Group I" = 15, "Group II" = 19,
               "Group III" = 17, "Group IV" = 18),
    name = "Group"
  ) +
  labs(x = "Surgery Year", y = "Outcome") +
  theme_hv_manuscript() +
  theme(
    legend.position  = "bottom",
    legend.direction = "horizontal"
  )
8.5 Suppress all legends
theme(legend.position = "none") hides every legend in one shot. Alternatively, guide = "none" on each scale_*() call drops only that aesthetic’s legend, handy when you want a colour legend but no shape legend.
dta_km <- sample_survival_data(n = 500, seed = 42)
km     <- hv_survival(dta_km)

plot(km) +
  scale_color_manual(values = c(All = "steelblue"), guide = "none") +
  scale_fill_manual(values  = c(All = "steelblue"), guide = "none") +
  scale_y_continuous(breaks = seq(0, 100, 20),
                     labels = function(x) paste0(x, "%")) +
  scale_x_continuous(breaks = seq(0, 20, 5)) +
  coord_cartesian(xlim = c(0, 20), ylim = c(0, 100)) +
  labs(x = "Years after Operation", y = "Freedom from Death (%)") +
  theme_hv_manuscript()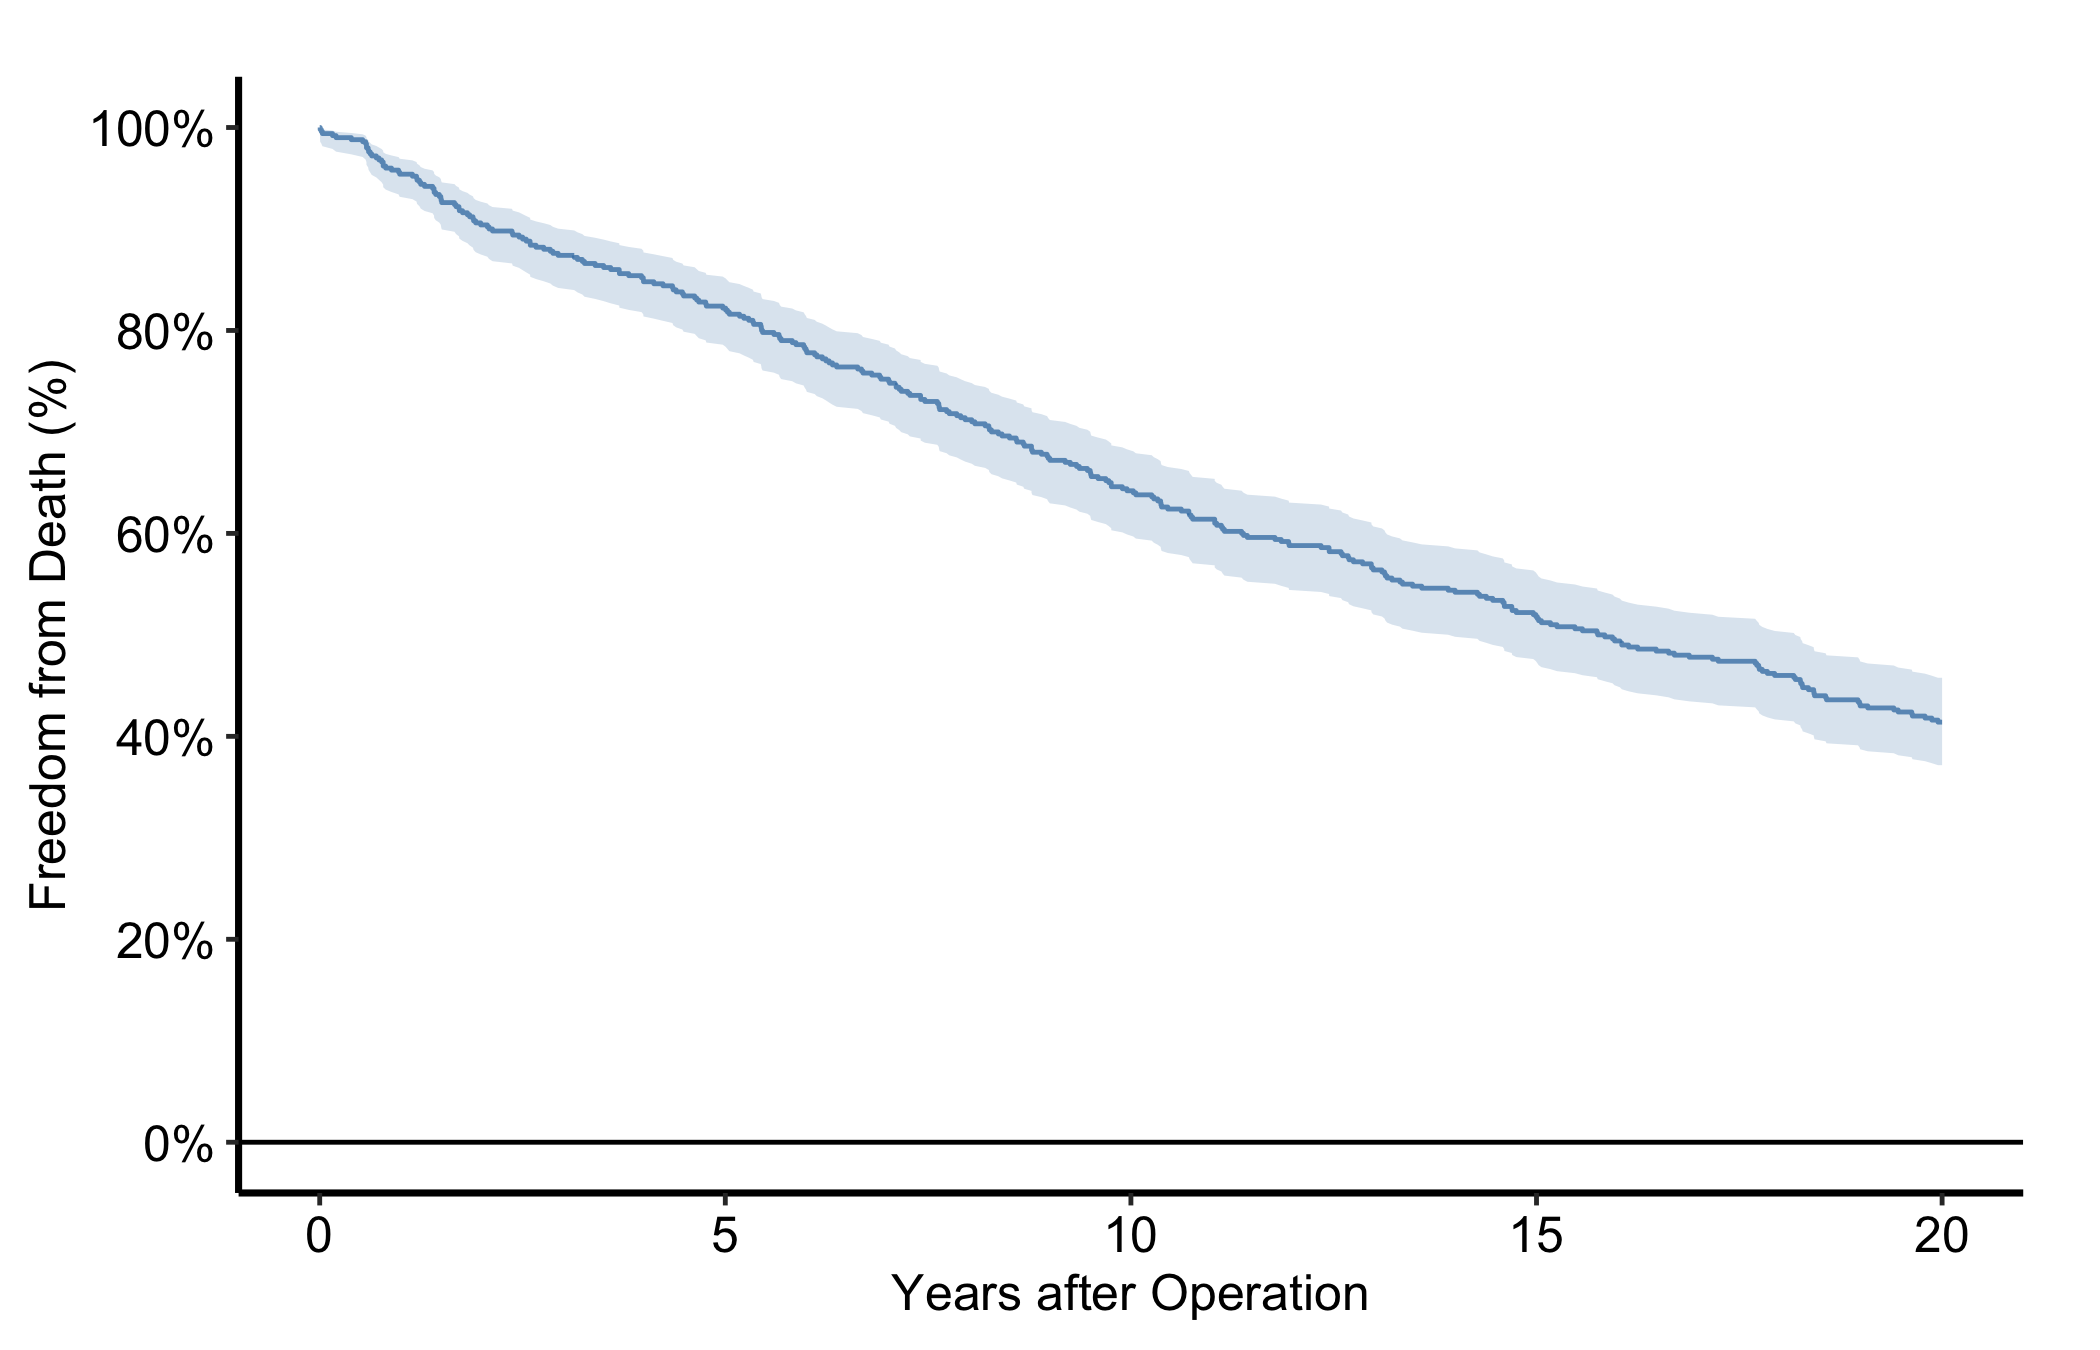
8.6 Legend text and key size
The legend inherits the theme’s font size, often larger than needed inside a crowded panel. legend.text controls the label font; legend.key.size shrinks the colour/shape swatch.
p_base +
  scale_colour_brewer(palette = "Set1", name = "Group") +
  scale_shape_manual(
    values = c("Group I" = 15, "Group II" = 19,
               "Group III" = 17, "Group IV" = 18),
    name = "Group"
  ) +
  labs(x = "Surgery Year", y = "Outcome") +
  theme_hv_manuscript() +
  theme(
    legend.text     = element_text(size = 9),
    legend.key.size = unit(0.4, "cm")
  )
8.7 Pitfalls
- The legend covers data. Moving a legend inside the panel saves width, but the inside of the panel is where the data live. Drop the box on a corner that looks empty today and it can sit squarely on a curve once you change the data, the axis range, or the cohort. Check the placement against the actual figure, not a mental image of it, and prefer a corner the data genuinely avoid (the lower-left of a survival curve, the upper-left of a rising trend). When no corner is safe, move the legend to the bottom rather than forcing it over the data.
hv_legend_inside()(above) automates exactly this check – emptiest corner, or an outside fallback when none is clear – so it does not have to be redone by hand each time the data change. - Redundant legends. A legend that repeats what the panel already says is clutter. If an annotation labels each line, or the axis names the single group, the legend adds nothing and costs space. The same redundancy creeps in when colour and shape both map to the same grouping and each gets its own legend box: suppress one with
guide = "none"so the reader sees a single key, not two that say the same thing. Every element on the figure should earn its place; a legend that names something already named does not.