p <- plot(hv_survival(sample_survival_data(n = 500, seed = 42)))
p + theme_hv_ppt_dark(base_size = 18) +
  theme(plot.background = element_rect(fill = "grey15", colour = NA))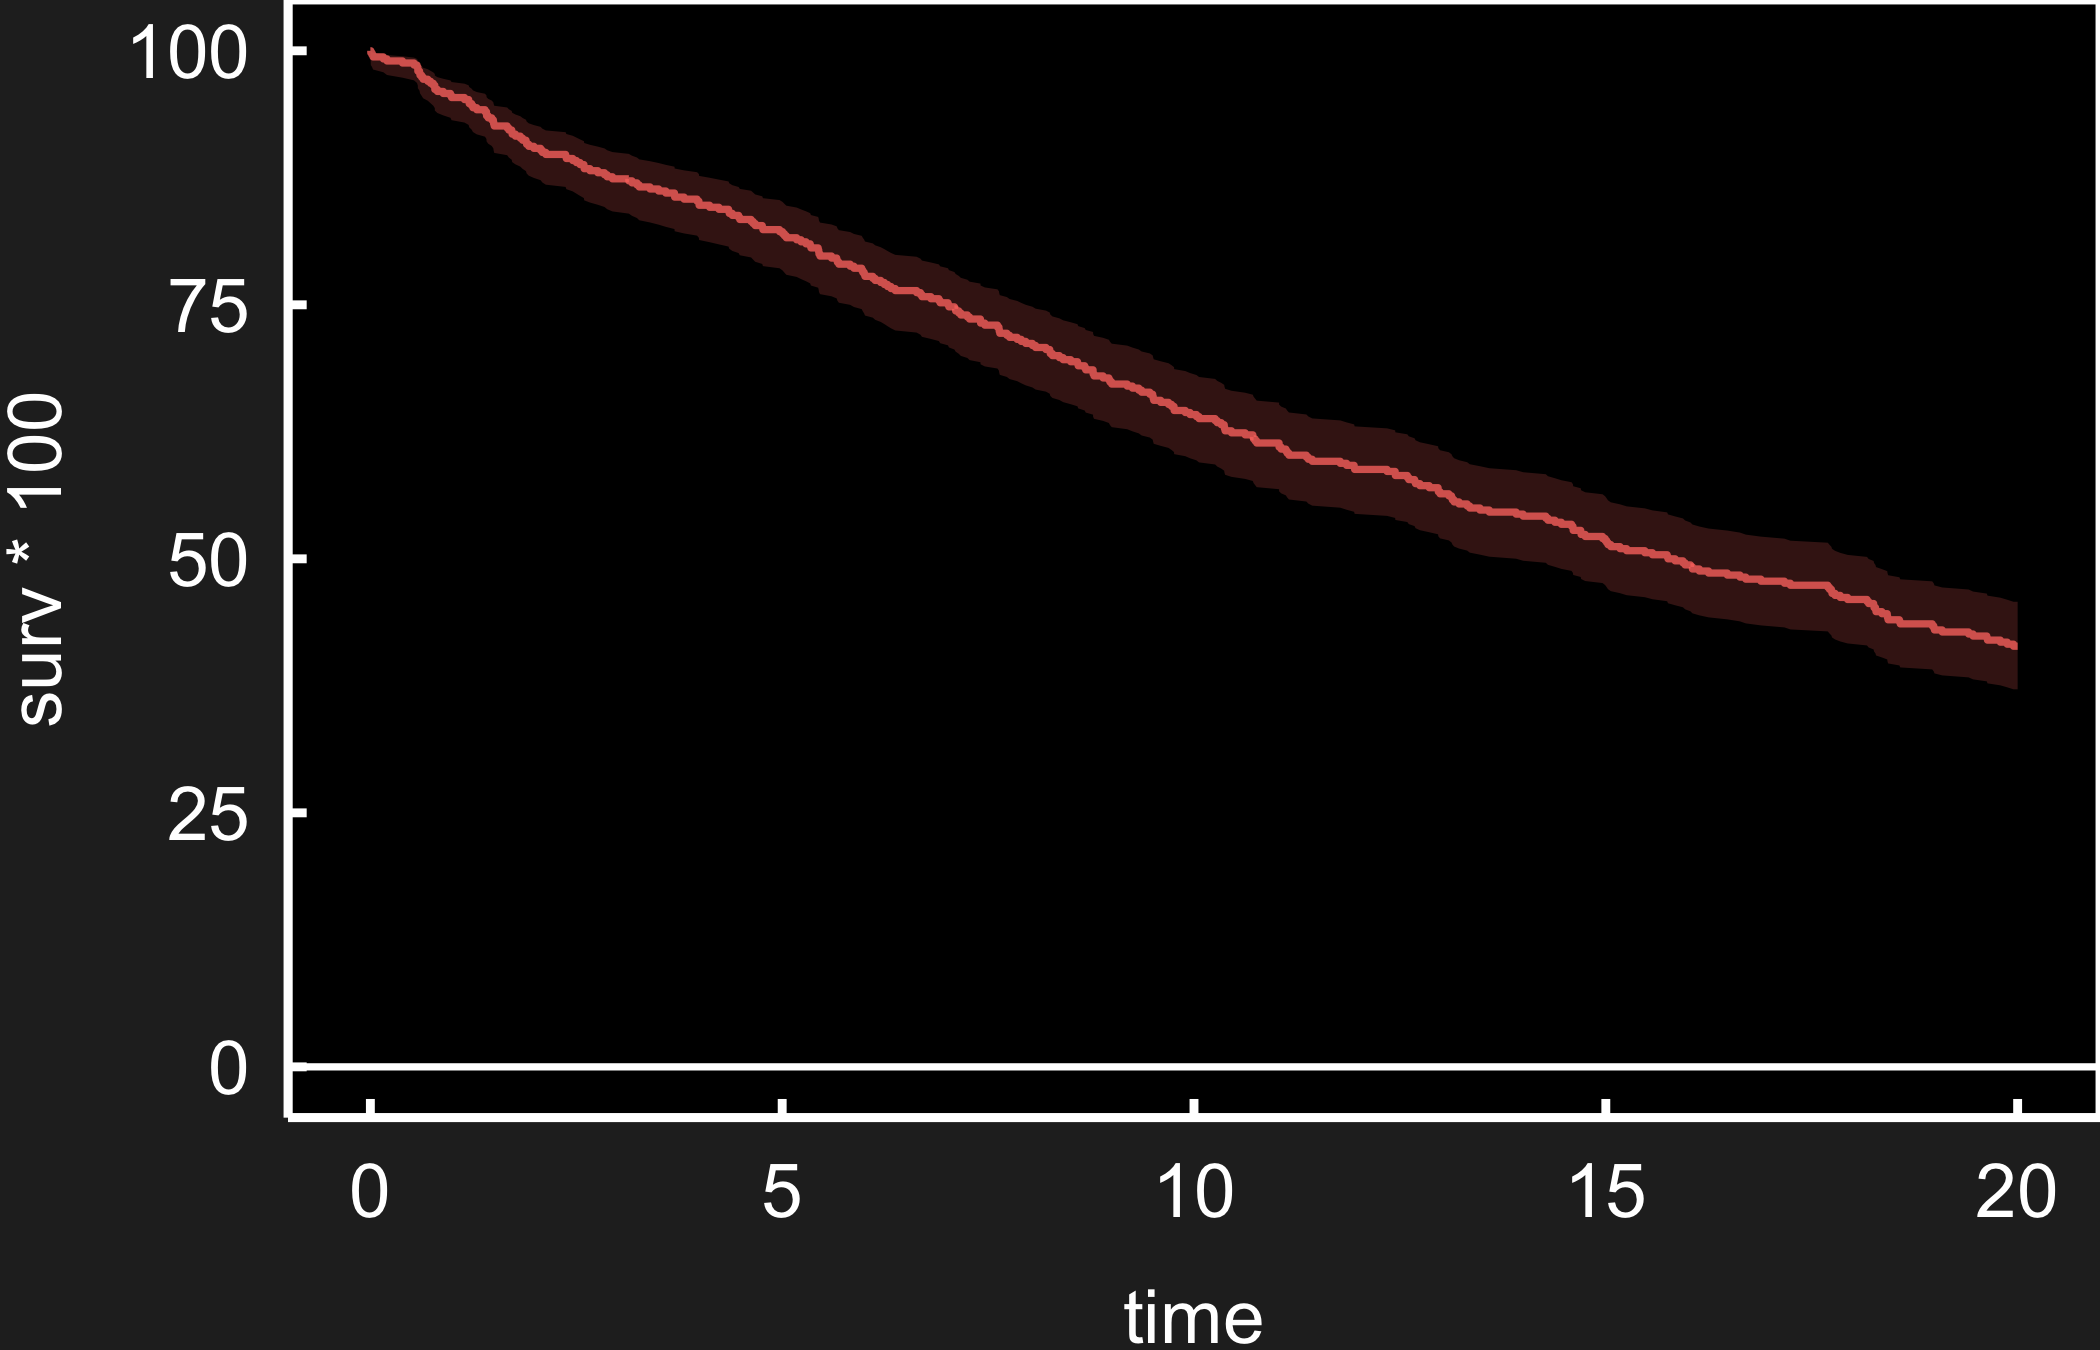
A slide is read from across a room and sits on a coloured background, not white paper. Two things change from a manuscript figure. The type scales up the way a poster’s does, so it carries to the back of the room; and the theme has to match the deck — dark for a projected slide, light or transparent for a printed handout or a light template. hvtiPlotR ships a pair of PowerPoint themes for exactly this, plus save_ppt(), which drops the finished plot onto a slide as an editable vector graphic rather than a flat image.
theme_hv_ppt_dark() styles a plot for a projected deck: white ink, no gridlines, and a large base size so the figure reads from the back of the room. It deliberately leaves the figure background transparent so the slide’s own background shows through — which is what you want on a real deck, but it makes the white axis text vanish on this white page. For the preview below we add a dark plot.background to stand in for the slide; on the actual deck, drop that line and let save_ppt() place the transparent figure on the slide.
p <- plot(hv_survival(sample_survival_data(n = 500, seed = 42)))
p + theme_hv_ppt_dark(base_size = 18) +
theme(plot.background = element_rect(fill = "grey15", colour = NA))
theme_hv_ppt_light() is the same typography on a light or transparent background, for a printed handout or a light template.
p + theme_hv_ppt_light(base_size = 18)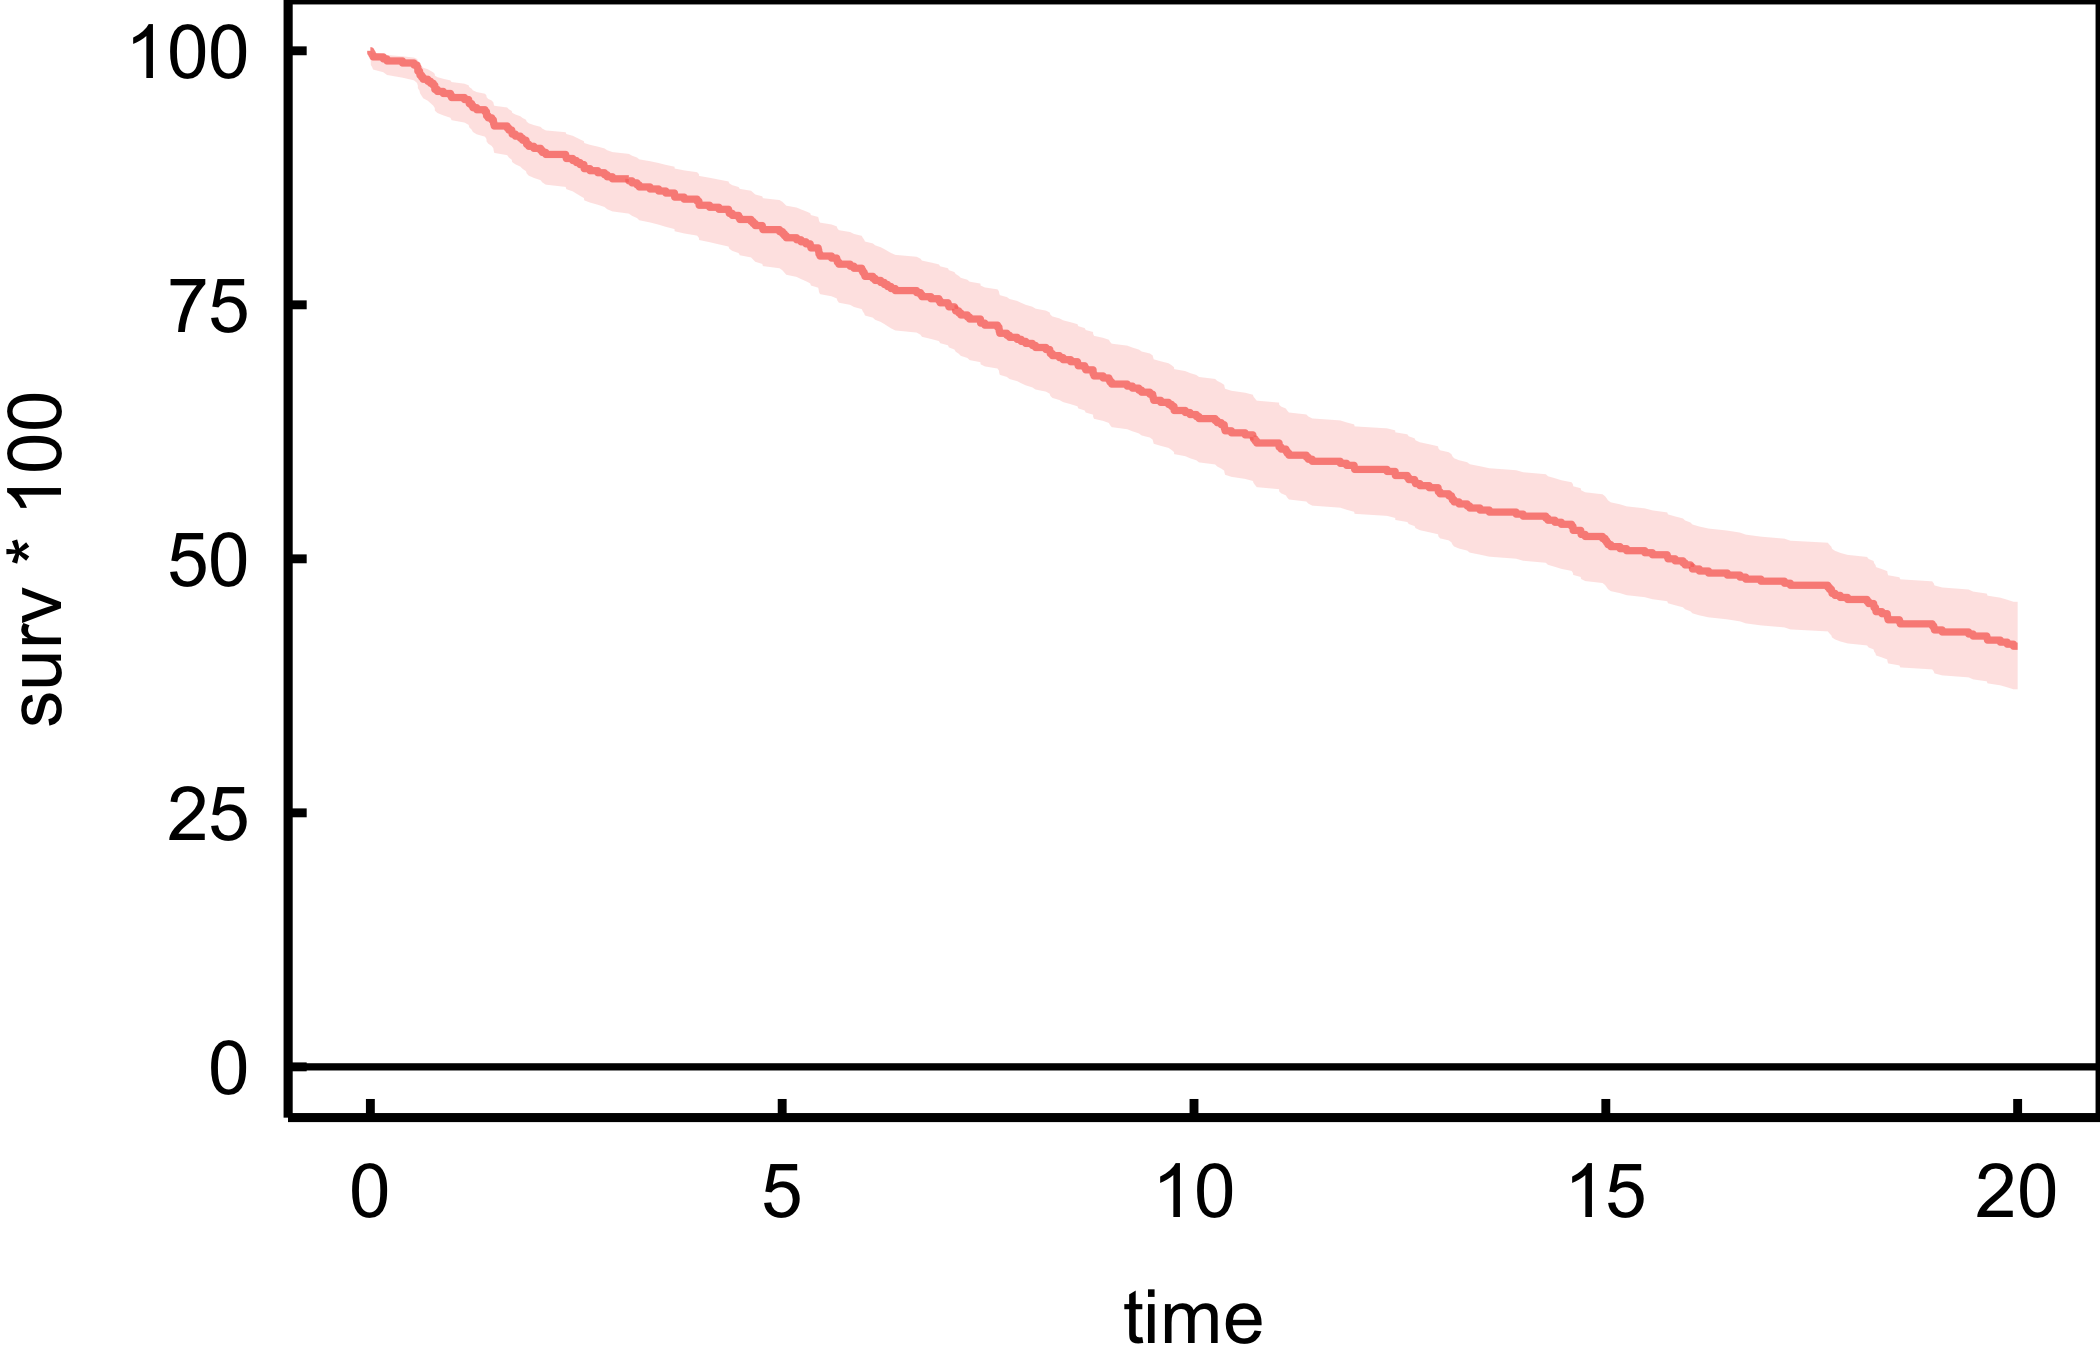
Both themes default to a 32 pt Arial base — sized for a slide projected across a room. We drop base_size to 18 here so the figure previews legibly on the page; leave it at the default for the real deck, and raise it further for a large hall.
A figure exported as a PNG is frozen: a reviewer who wants the title reworded or a colour swapped has to come back to you. save_ppt() instead writes the plot onto a slide as a native vector graphic, so its text, lines, and colours stay editable in PowerPoint itself. It anchors the plot in the panel rectangle of a house slide template, so every figure lands in the same place across a deck.
save_ppt(
  p + theme_hv_ppt_dark(),
  template   = "RD-dark.pptx",
  powerpoint = "survival_slide.pptx"
)
The chunk is eval: false because it writes a binary .pptx. The code is shown, not executed during the book build. Pair the dark theme with a dark template and the light theme with a light one, and keep theme_hv_ppt_dark() at its 32 pt default here — the template is laid out for that size. Pass panel_box to move or resize the plot rectangle, and slide_titles to set the slide heading. ```